Analysis
Amplification
To test our design, we broke up our experiments into 4 sections:
- Confirming that we could reproduce the results from the Hsing et al.(2014) paper on nonlinear HCR (described in the design section).
- Testing the design, by reproducing the results with different sequences.
- Testing the adaptor system
- Testing the triple dendrimer system
Sections 1 and 2 were tested in parallel. To ensure transparency all gels produced and their procedures are included, however, to keep this page interesting, the most successful gels are included before the others.
All systems were incubated for 30 minutes, before the gels were loaded and run.
Goal achieving gels
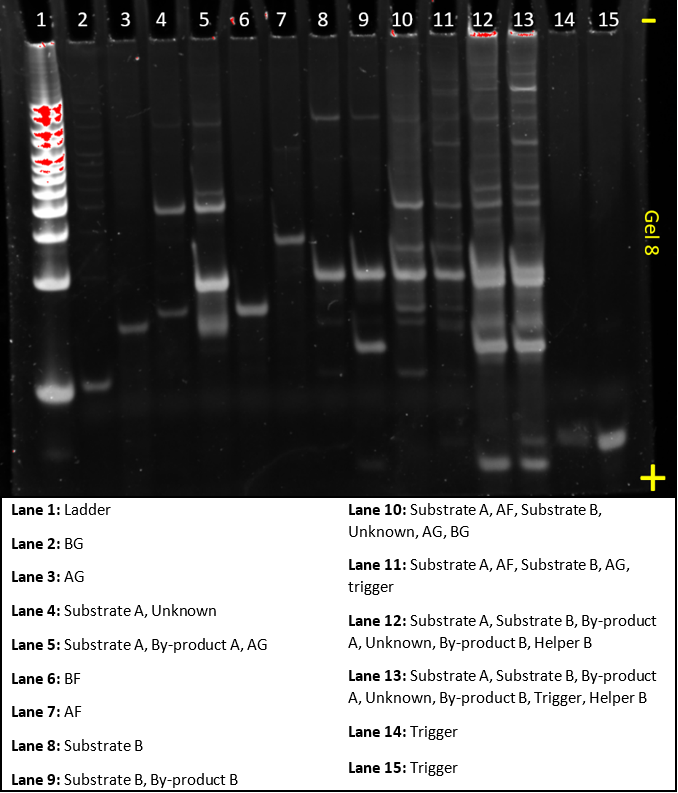
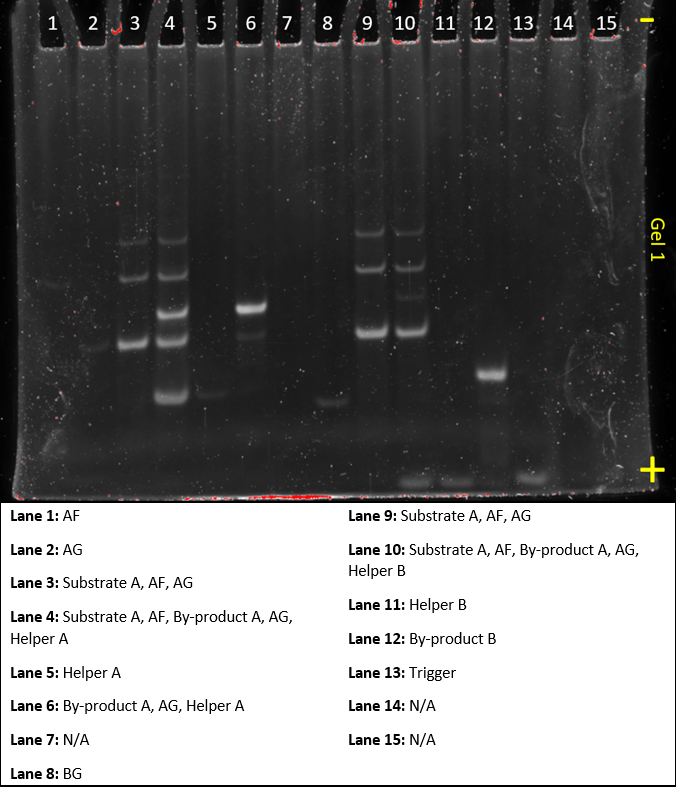
Gel 8
In this gel, we tried to make the dendrimer from the Hsing et al.(2014) paper.
Despite a small mistake in accidentally putting BG in lane 2 and AF in lane 7, rather than the other way around, this gel confirmed that the system worked. We reproduced the Hsing et al.(2014) results. Lane 10 shows that without helper or trigger strands, no dendrimer band forms. Lane 11, similarly, demonstrates without helper no dendrimer band forms. A faint band of a similar size to the dendrimer appears in lane 12, which lacked trigger. However, when compared to lane 13, it’s very clear that the reaction is much more successful with trigger as the very bright band at the top indicates dendrimer formation. It also shows that in absence of trigger, the system has very limited false positives.
There are still some ‘mystery bands’ in this gel. These could be intermediate stages or some unexpected bonding between two strands or complexes. Some computer simulations could be run, to clarify what these bands might be.
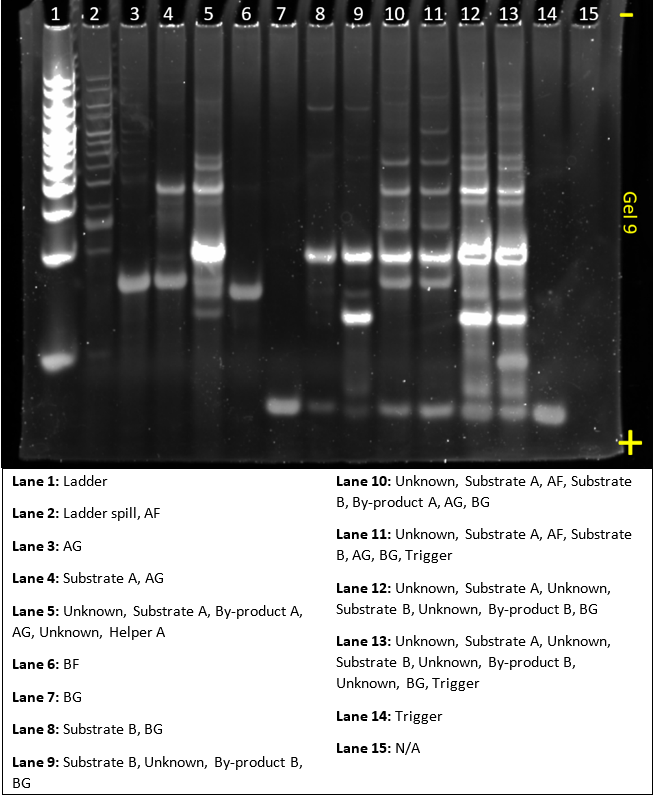
Gel 9
In this gel, we tried to make a dendrimer using our sequences. This gel was run in parallel with gel 8.
Most of the complexes still formed as expected. There is still sign of some dendrimer formation at the top of lane 13, with slightly brighter bands than lane 12. But nothing very definitive. For future design, we’ll do more modelling to see how the strands are predicted to interact. The ladder and byproduct A bands are still quite saturated and should be reduced in concentration.
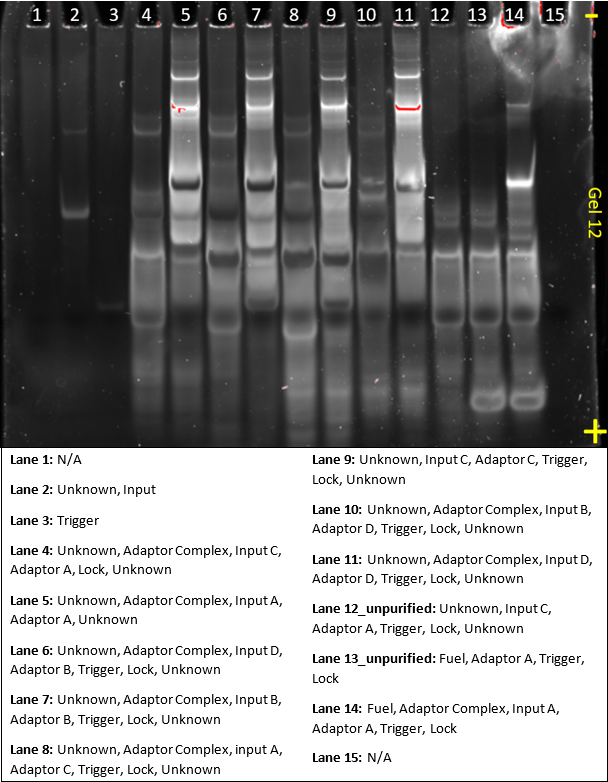
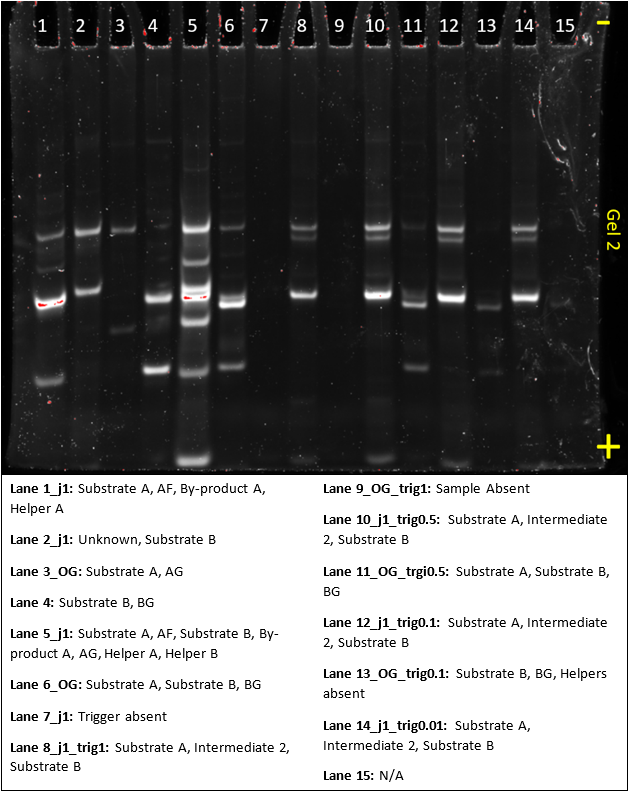
Gel 12
Gel 12 was produced to confirm the results from gel 10 and 11, and to test whether the adaptor would remain stable in the presence of fuel.
The gel is quite saturated and the concentrations of every sample should be lowered. Aside from saturation, the gel does again demonstrate the specificity of the adaptor. Adaptor A and C were tested against each other, which are the same design but with a different sequence. Adaptor B and D were a modification of the design used for A and C, but accounted for prevention of off-target complexes. B and D also had different sequences to one another. None of the adaptors formed Input-Adaptor complexes with the wrong input.
Additionally, lane 13 included fuel but a mismatched input, but still no adaptor-input or adaptor-fuel complex was formed, showing that the adaptor remained stable, despite the presence of fuel strands.
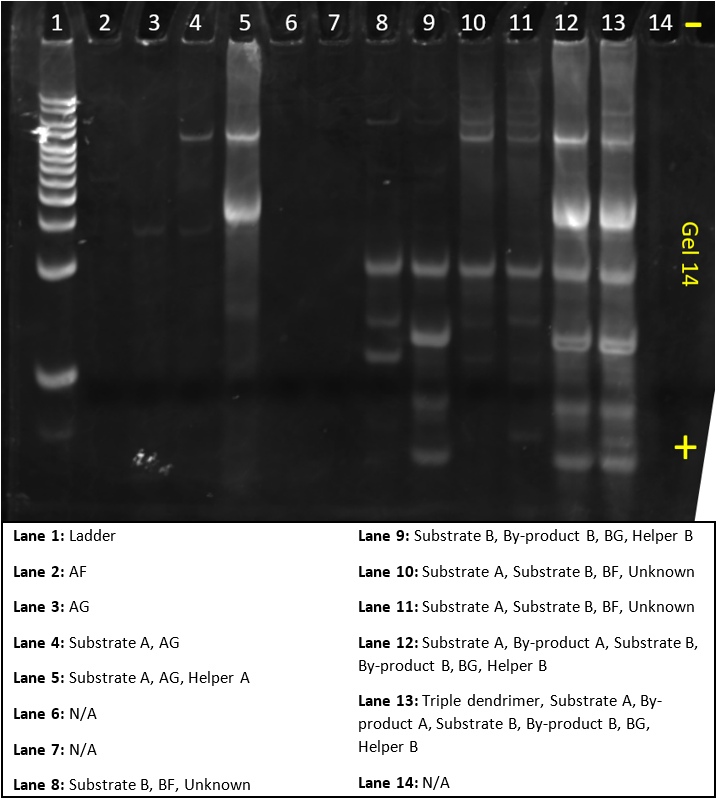
Gel 14
In this gel, we tried to make the third order amplification system.
The gel does contain some error; BF and BG did not show in lane 6 and 7, there was a mystery strand in lane 8, 10, and 11, and lane 12 and 13 have some saturated strands.
On the other hand, the band at the top of lane 13, appears only in lane 13 and shows that the triple dendrimer system we designed worked successfully.
Other gels
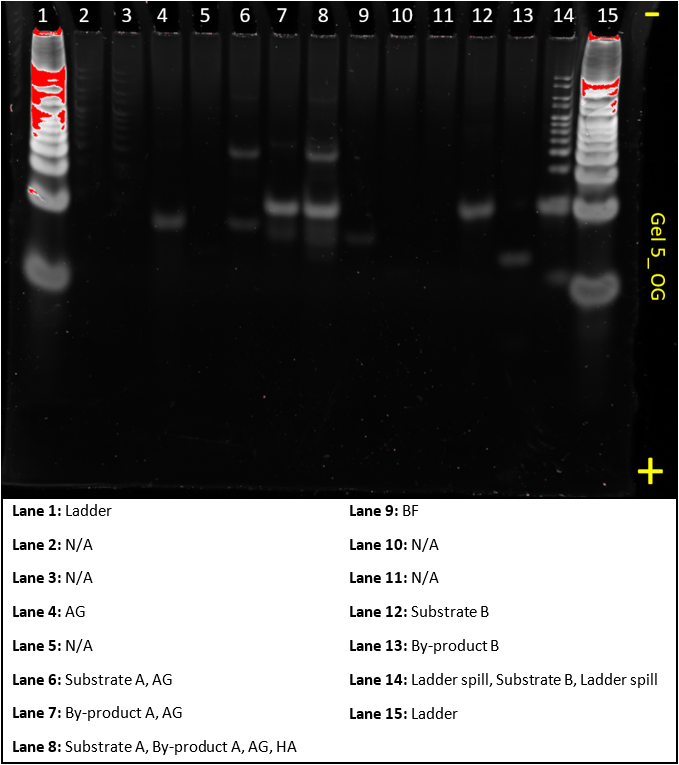
Gel 1
The main purpose of gel 1 was to see whether it was possible to make substrate A in lane 1 to 6, and substrate B in lane 7 to 13, with sequences that were different from the Hsing et al.(2014) paper on nonlinear HCR.
Substrate A worked relatively well, showing the expected number of bands, with AF seeming absent in lane 1, possibly due to low concentration.
The assembly of substrate B was a little more problematic as the lanes look identical to those for substrate A. So much so, that we may very well have added the components for substrate A instead of B in lane 7-10. Additionally a band shows up at the bottom of lane 10-13, this is probably Helper B, as lane 11 contains only Helper B and only 1 band showed up in that lane. Due to lack of experience with IPAGE, some Helper B probably spilled into neighbouring lanes, alternatively, we may have added it to the lane thinking we were using it to make substrate B and byproduct B. Finally, lane 13 had the trigger strand in it, which could have run off the gel as it was left possibly for longer than it should have been.
Gel 2
This gel was done to compare the functionality of the original dendrimer from the Hsing et al.(2014) paper and our design sequence j1. It also looked at adding different amounts of trigger to the reaction to see the amount of trigger needed.
Lane 5 clearly shows that the new sequence functions as expected. However, as we forgot to add the helper strands to lane 6, 11, 13, and 15, we can’t compare it in functionality with the original sequence. Lane 8, 10, 12, and 14 show that as less trigger is added, more substrate B remains in solution, indicating that more dendrimer molecules have formed.
Some mistakes were made in this gel, such as accidentally omitting Helper strands, having the trigger strand run off the gel in lane 7 and having an empty lane 9, which should have looked like lane 8. This was only our second gel, so they will hopefully get better as we progress.
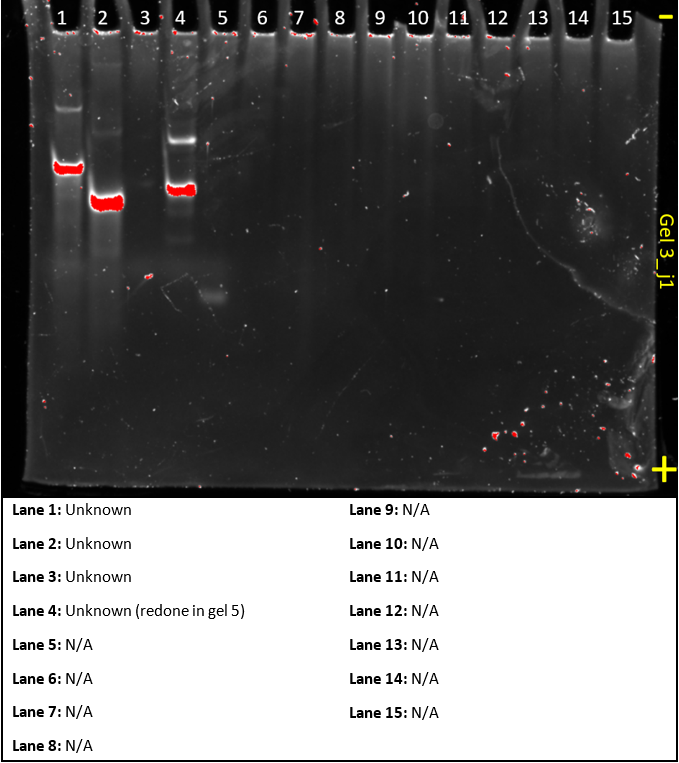
Gel 3
This gel was meant to act as a control for making substrate A and B. But we very clearly had a bad lab day, as none of the results make any sense. In the future, we’ll reduce concentrations and write out clearer, stepwise protocols to avoid errors.
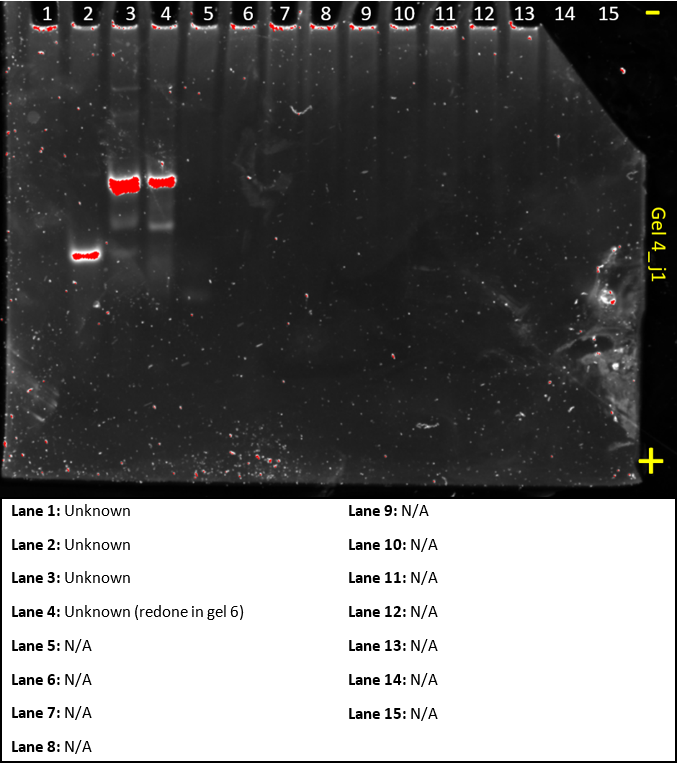
Gel 4
This gel was meant to act as a control for making substrate A and B. It was produced on the same ‘bad lab day’ as gel 3 and similar modifications will be made in future experiments.
Gel 5
This gel was a ‘do-over’ of gel 3 and 4, it aimed to show that all the substrates and helper sequences work as predicted as in gel 2, not all the results made sense.
Lanes 3, 5, 10 and 11 are missing AF, Helper A, BG and Helper B respectively. This could have been caused by insufficient mixing of our samples and hence a low concentration of DNA. To improve on this, we will ‘re-do’ this gel to confirm that that was the problem.
The lanes that showed up show exactly what we’d expect and confirm the system works.
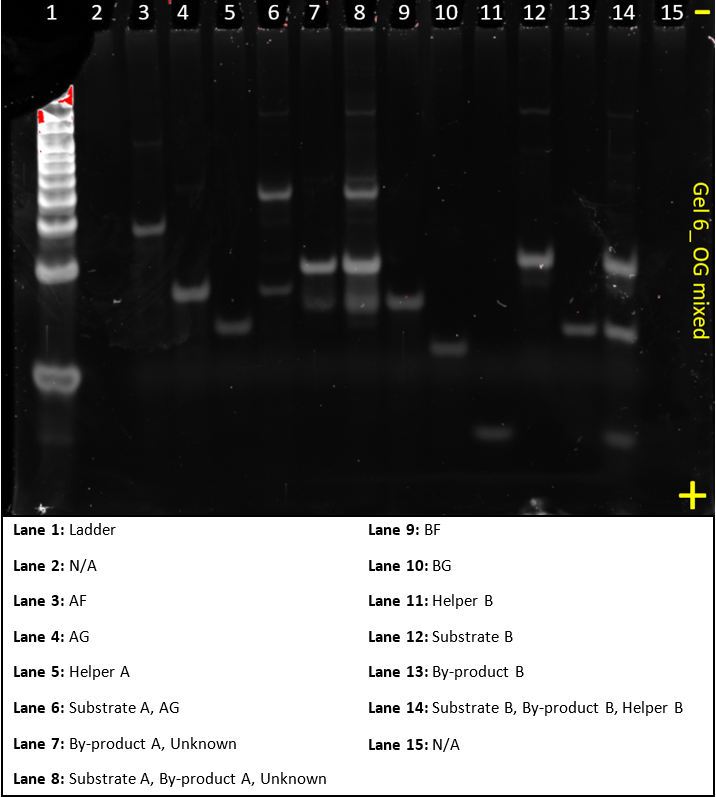
Gel 6
This gel was a ‘do-over’ of gel 5, it, again, aimed to show that all substrates and sequences worked as expected.
This gel worked much better than the previous three and very clearly highlighted that when you add the AF sequence to excess AG, a larger complex, Substrate A, formed. When Helper A was added to that, byproduct A formed. Similarly for complex B, when adding BF, BG and Helper B, Substrate B and Byproduct B formed.
There were still some unidentified bands. These could be intermediate stages or some strands binding to one another in way that was not expected. Additionally the ladder was quite saturated, the concentration should be reduced in future experiments.
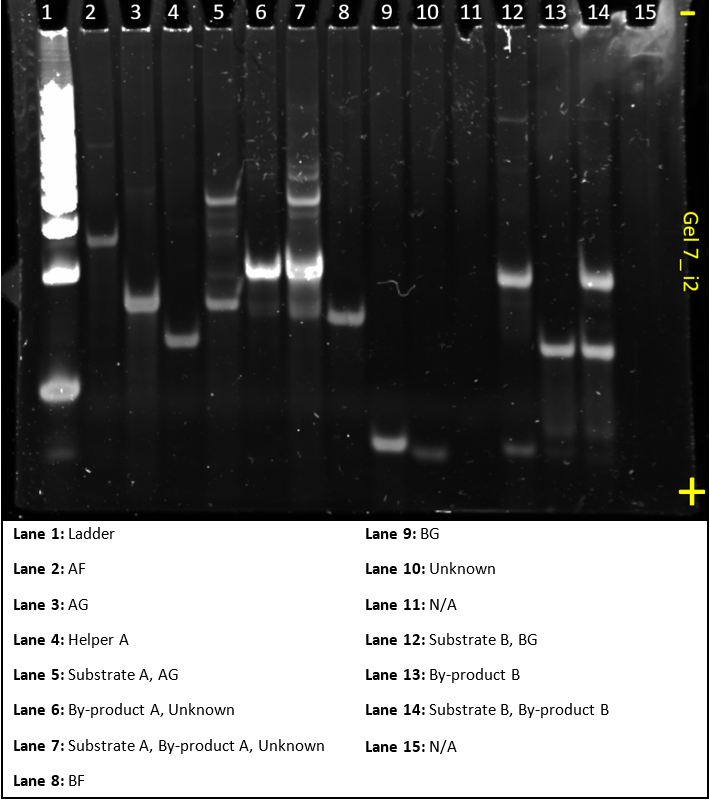
Gel 7
Gel 7 had the same purpose as gel 6, but rather than using the Hsing et al.(2014) sequence, used one of our designs, i2. And was run parallel to gel 6.
It looks very similar to gel 6 and, like gel 6, plainly shows that the system is working as anticipated. All the A sequences combine to make larger A complexes and all the B sequences combine to make larger B complexes. Next gel, we’ll be ready to make the dendrimer.
Some bands, like byproduct in lane 6 and 7 were quite saturated. Some concentration adjustment will have to be taken into account for the next gel. The ladder concentration should also be reduced. Finally, lane 14 shows a skew in the bands on the right hand side. As the samples contained Mg2+ the PAGE process caused the sample on the right hand side of the lane to travel faster. In future gels, this will be accounted for by adding Mg2+ buffer in any unused lanes before running gels.
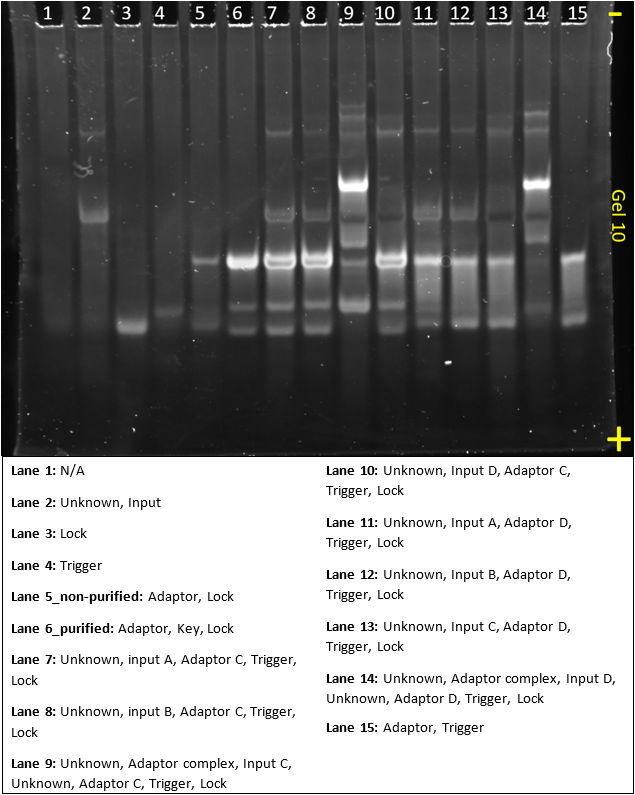
Gel 10
This gel tests the specificity of the adaptors.
This gel quite clearly showed that the adaptor only binds with the specific input strand. This is quite promising as our design would only bind to the DNA input strand of interest.
The adaptor strands are quite saturated and a reduction in concentration could help in showing some of the fainter bands.
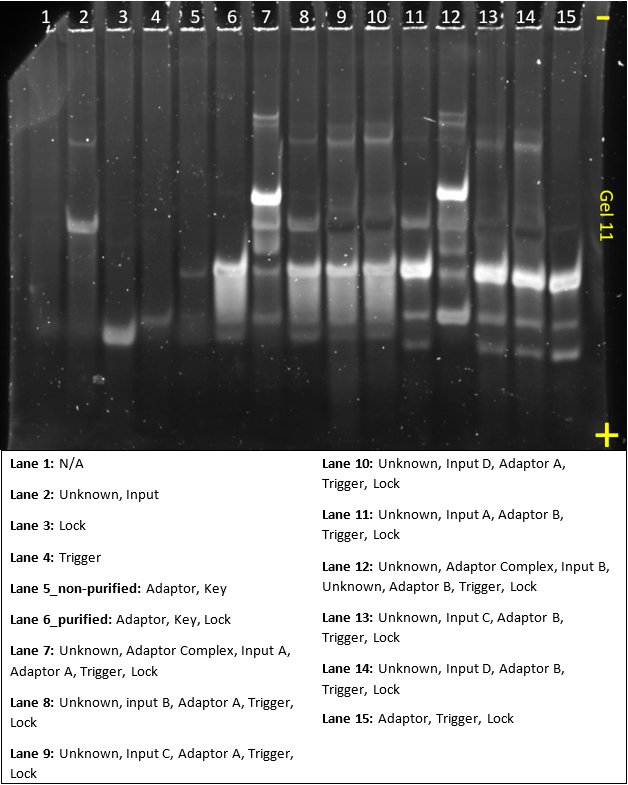
Gel 11
This gel tests the specificity of the adaptors. It tests a different design sequences from gel 10 and was run in parallel
The results of this gel are quite similar to gel 10, again showing specificity, but also very saturated bands.
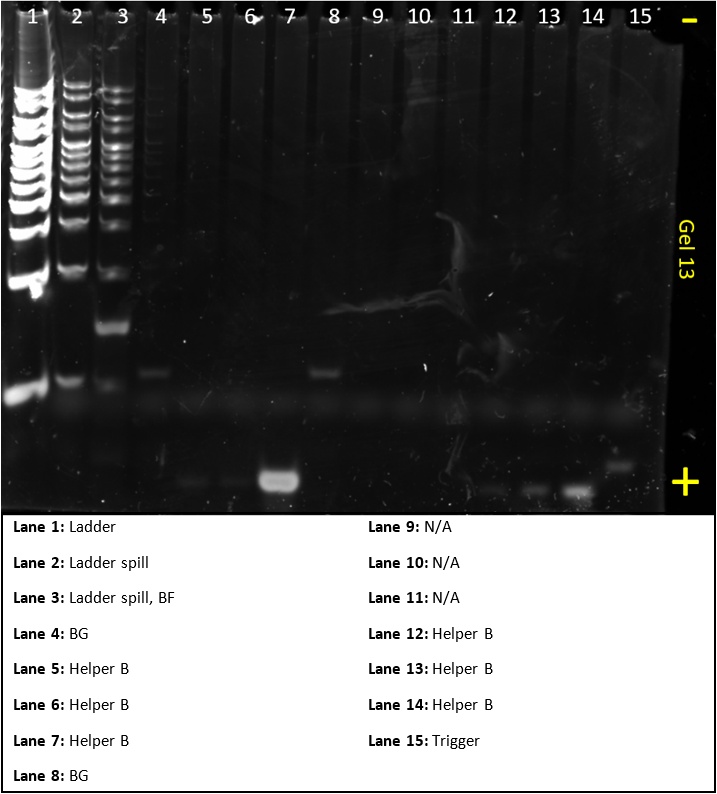
Gel 13
In this gel, we were waiting for part of our DNA still, so we could only make controls. The gel was run in an attempt to demonstrate that all substrates and complexes still formed as expected.
From the image, it’s quite clear that this gel was made during another ‘bad lab day’. Ladder concentration is still too high and some ladder was spilled into lane 2 and 3. Most bands didn’t show up and this gel can’t really be used to analyse the system. As we are low on time, this gel won’t be re-done and instead we’ll try to make the whole third order system next gel.
Detection
Stage 2: Designing a one-way hinge
Having designed versions 3 through 6 of the one-way hinge, with sub-versions varying the length of the hinges, the staples for each design were ordered, pooled with M13 ssDNA scaffold with 2-30 mM of Mg2+, and annealed for 18h. The resulting origami was purified by agarose gel electrophoresis. The band representing version 6 was extracted and imaged by transmission electron microscopy (TEM). |
Introduction
In the Design phase, we created versions 3, 4 and 5 of the one-way hinge, which differed in the positions and number of scaffold and staple crossovers. For each version, we also created 3 sub-versions, with hinges 5 bases long, 10 bases long or 24 bases long. From these sub-versions, we wanted to investigate which design was optimal for folding.
For the DNA to fold into the intended structures, the staples and scaffold must be mixed, and this mixture must be incubated. However, the folding process also involves several other parameters:
- Temperature ramp: The mixture of DNA is first heated up to 65°C for 15 min to denature any secondary structures that may have formed in the DNA strands. The mixture is then cooled to 25°C. As the mixture cools, the staples and plasmids will self-assemble into DNA origami. The temperature ramp describes rate at which the temperature is decreased. Literature suggests that the folding of staples and scaffold occurs only within an optimal temperature range[1]. Hence, if a slower temperature ramp is used, the mixture remains within the optimal temperature range for a longer period of time, thus increasing the yield of successfully-folded DNA origami.
- Mg2+ concentration: Mg2+ ions must be present in the folding mixture to counter the negative charges on the backbone of the DNA, as this can result in electrostatic repulsion as the DNA attempts to fold, but Mg2+ concentrations that are too high instead prevent DNA structures from forming and instead create aggregates.
Hence, the optimal folding conditions were also investigated, by folding designs under different conditions and comparing them via agarose gel electrophoresis. Using the optimal design parameters and folding conditions obtained from the folding of versions 3 to 5, version 6 was designed and folded. It was then purified by agarose gel electrophoresis, and imaged by transmission electron microscopy (TEM). To aid an understanding of our experiments and results, an explanation of these techniques is included below.
Aim
This experiment aimed to identify the optimal design parameters and folding conditions of the one-way hinge, and then image the product to check if the origami had been successfully folded.
Agarose gel electrophoresis
In agarose gel electrophoresis, DNA samples are placed in wells at one end of an agarose gel. The gel is placed in an electrophoresis buffer, and an electric field is applied across the gel. As DNA contains a negatively-charged phosphate backbone, it moves through the gel towards the positive electrode. A DNA structure that is larger experiences greater resistance as it moves through the gel, and hence moves at a slower rate. DNA that is smaller or more compact will migrate over a larger distance. Hence, the DNA in a sample will separate into bands based on their size.
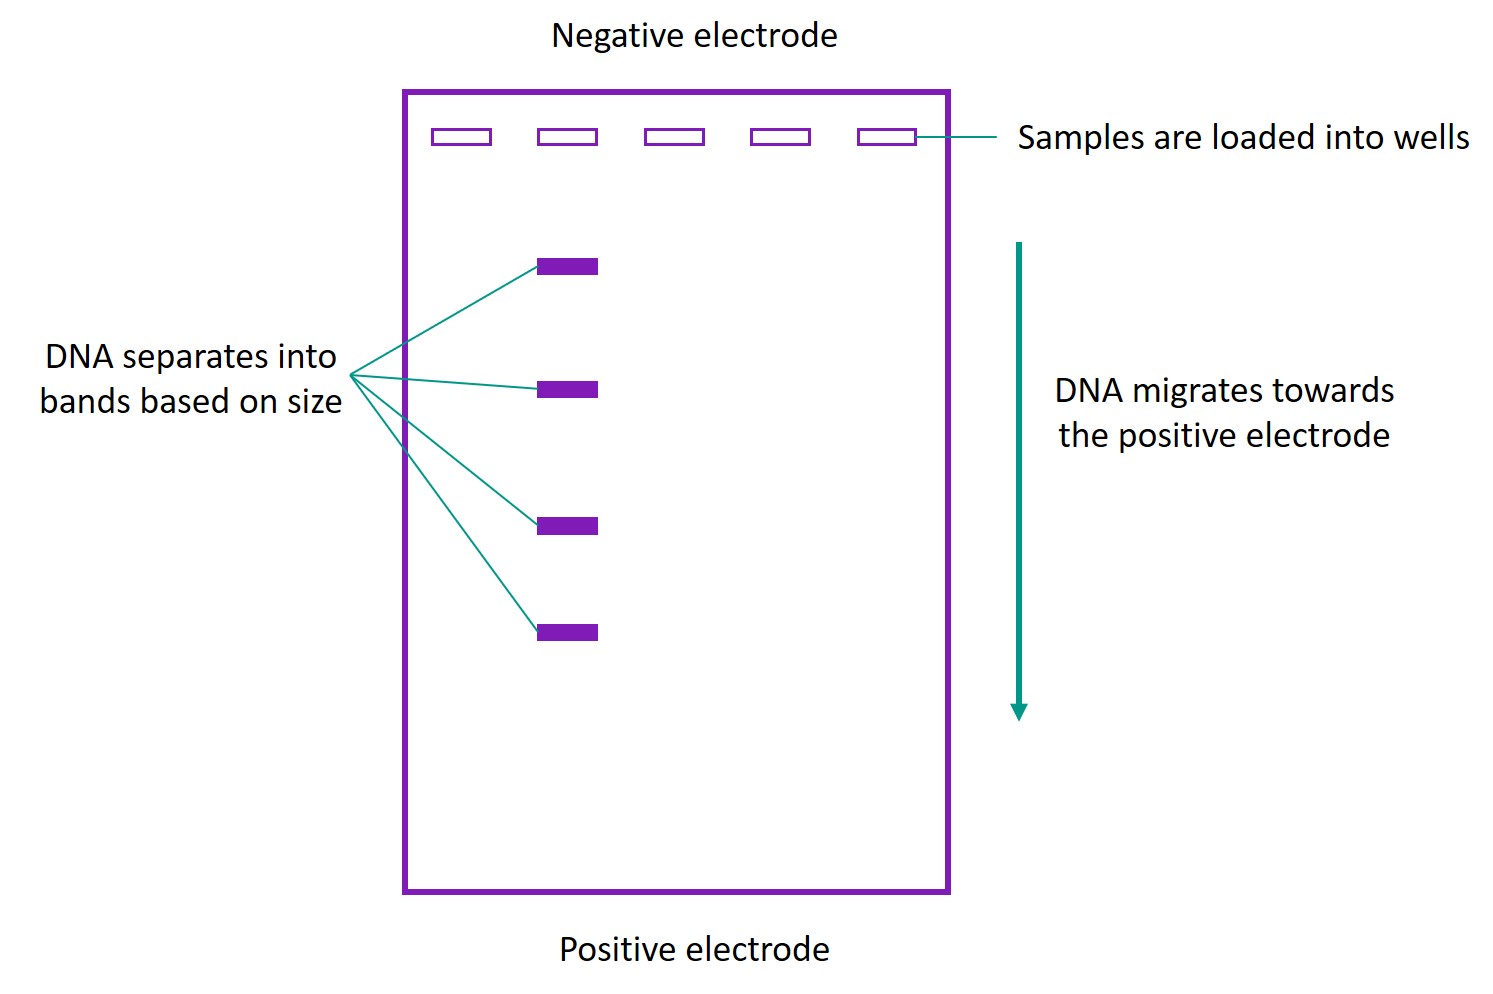
After a DNA stain has been added to the gel, these bands can be visualized under ultraviolet (UV) light. By comparing bands, we can compare the DNA samples. For example, for two samples that have the same structure but were folded under different conditions, if one band migrates more than the other, this can indicate that DNA in the first band was folded more compactly, which is desirable in folding DNA origami.
Furthermore, as the DNA is separated according to size, agarose gel electrophoresis can also be used to purify the product.
TEM
In normal microscopy, a light is shone on a sample. Different materials allow different amounts of light through. This allows us to obtain an image of the sample. In transmission electron microscopy, instead of light, a beam of electrons is fired at the sample. Different materials will interact with electrons in different ways - some materials will absorb electrons better than others, or even reflect electrons. After passing through the sample, the beam of electrons is collected by a fluorescent screen, and a computer program translates this into an image of the sample.
TEM is a valuable technique because of its extremely high resolution. Using electrons allows us to image objects on the nanoscale which would normally not be visible in light microscopy. For our DNA origami, which is less than 100 nm in length, TEM may be considered the best technique to image them.
Methods
For versions 3 to 5, folding mixtures were prepared, containing the M13mp18 scaffold at a concentration of 10 nM, staples at a concentration of 100 nM, and varying Mg2+ concentration. The folding mixtures were heated to 65°C for 15 min, and then cooled to 25°C over either 18 h and 66 h. 4 μL of loading dye was added to 20 μL of each product, and 20 μL of this mixture was loaded into a 2% agarose gel. The gel was run in 0.5x Tris/Borate/EDTA (TBE) buffer (11 mM MgCl2) at 60 V for 4 h, stained with Sybr Safe (a DNA stain) and visualized under UV light.
After identifying the optimal design parameters and folding conditions, version 6 was designed and folded accordingly. To aid imaging of the structure of the one-way hinge, version 8 was designed with the same structure as version 6 but twice the number of helices, and folded according. The products were run on a 2% agarose gel in 0.5x Tris/Borate/EDTA (TBE) buffer (11 mM MgCl2) at 60 V for 4 h, stained with Sybr Safe (a DNA stain) and visualized under UV light. The band corresponding to the folded DNA origami was cut out and the DNA was extracted, yielding a purified one-way hinge. The purified one-way hinge was imaged by TEM.
For more detailed protocols, click here.
Results
Figure 1 shows the gel in which the folded samples of version 3 one-way hinge, with the hinge length as 0 bases (resulting in an open conformation), were run.
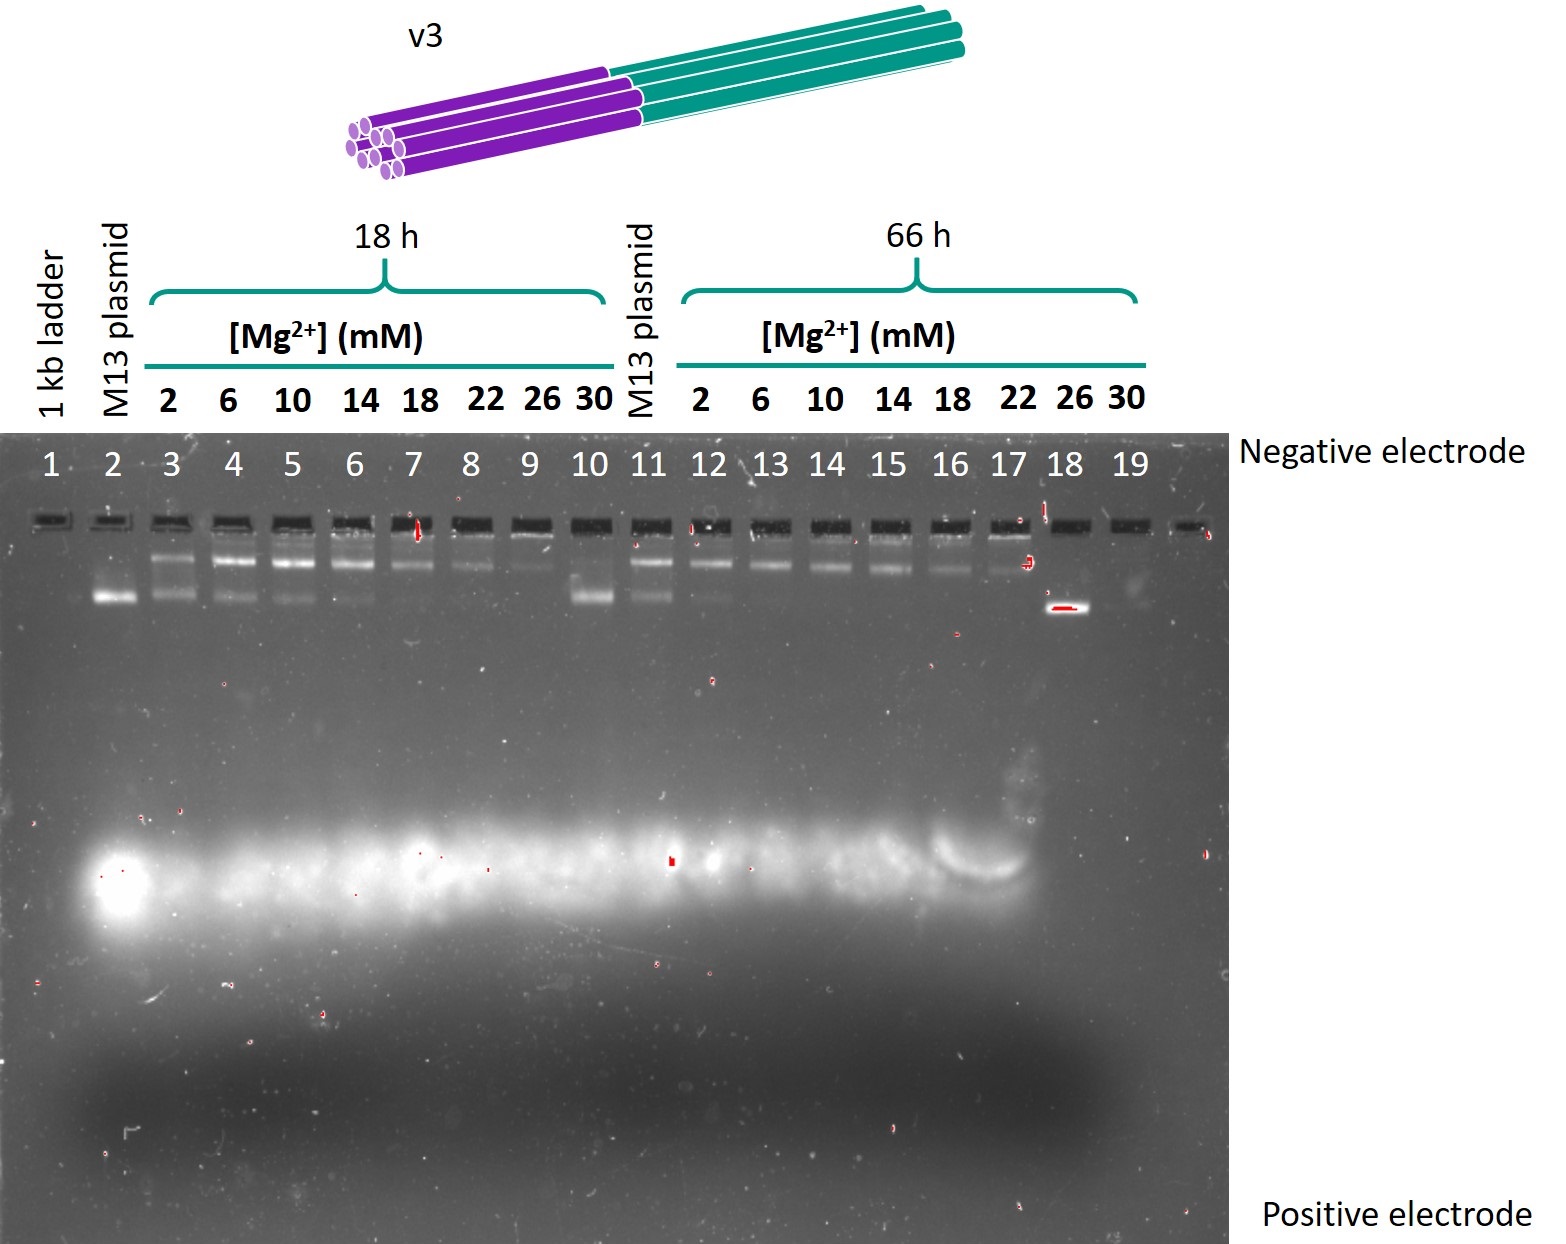
Figure 1: Gel run for version 3 one-way hinge, 24 base hinge.
Figure 2 shows the gel in which the folded samples of version 4 one-way hinge, with the hinge length as 24 bases, were run.
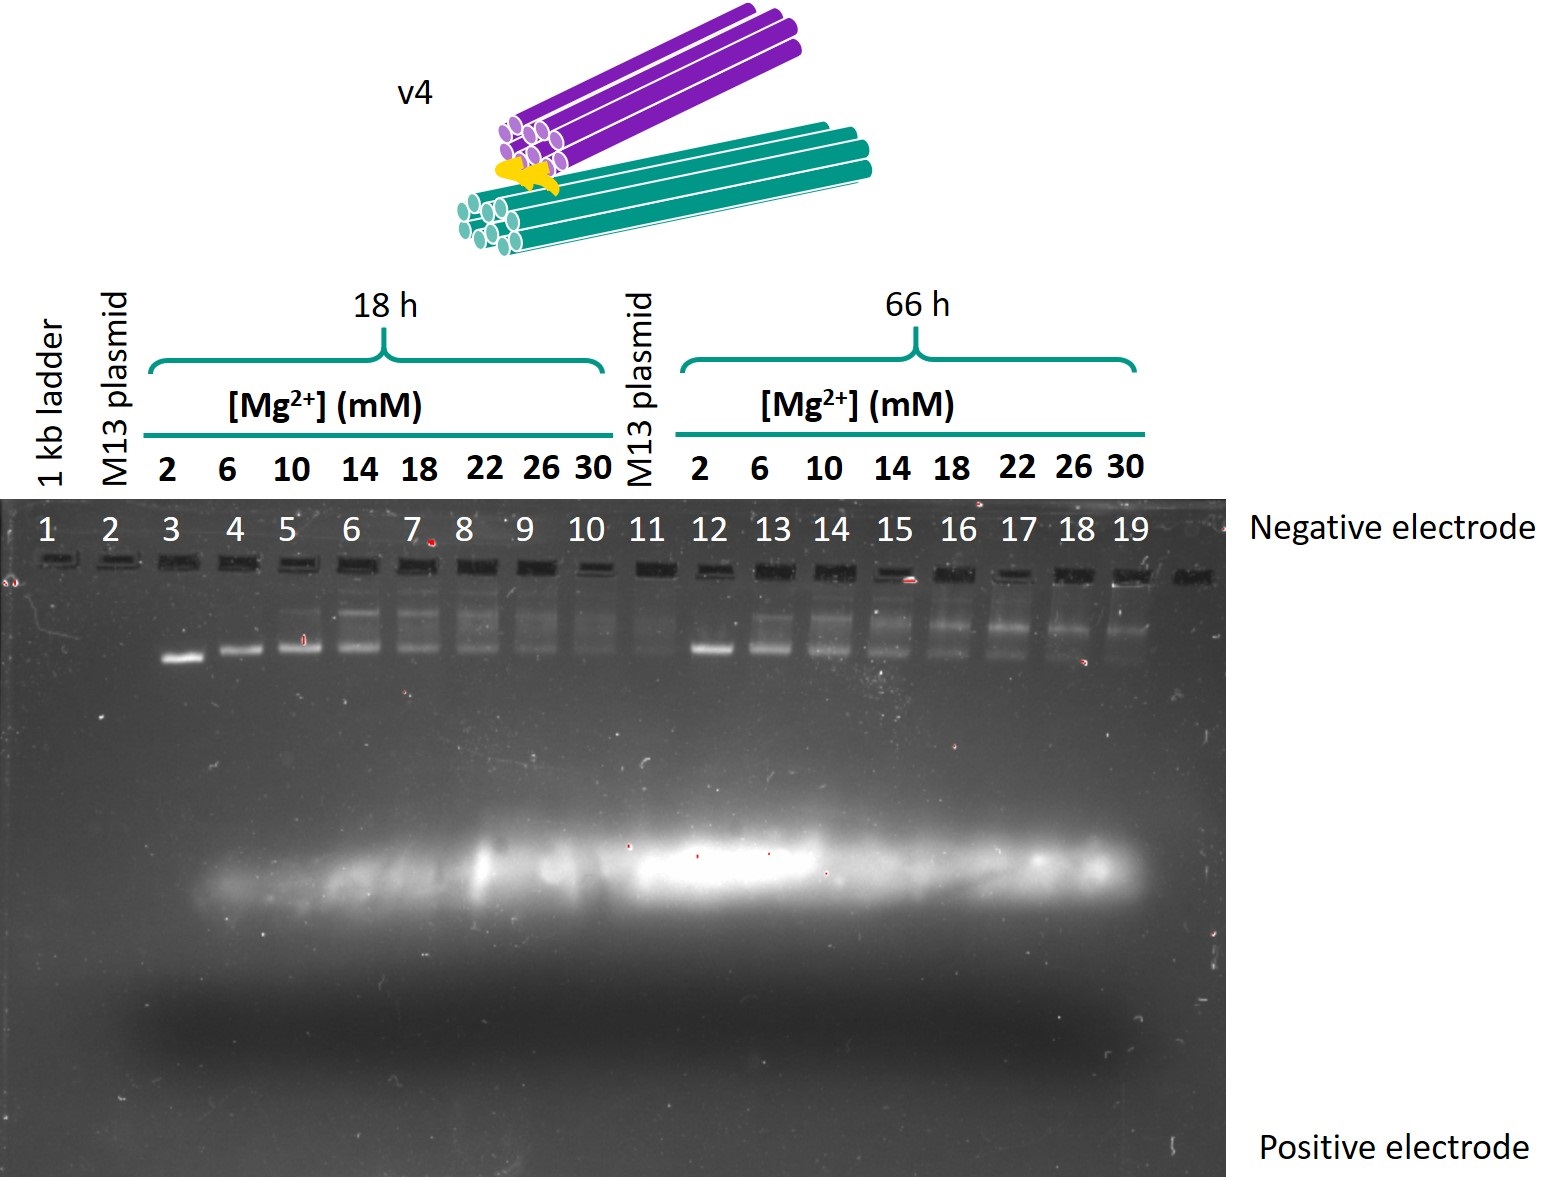
Figure 2: Gel run for version 4 one-way hinge, 24 base hinge.
Figure 3 shows the gel in which the folded samples of version 4 one-way hinge, with the hinge length as 24 bases, were run.
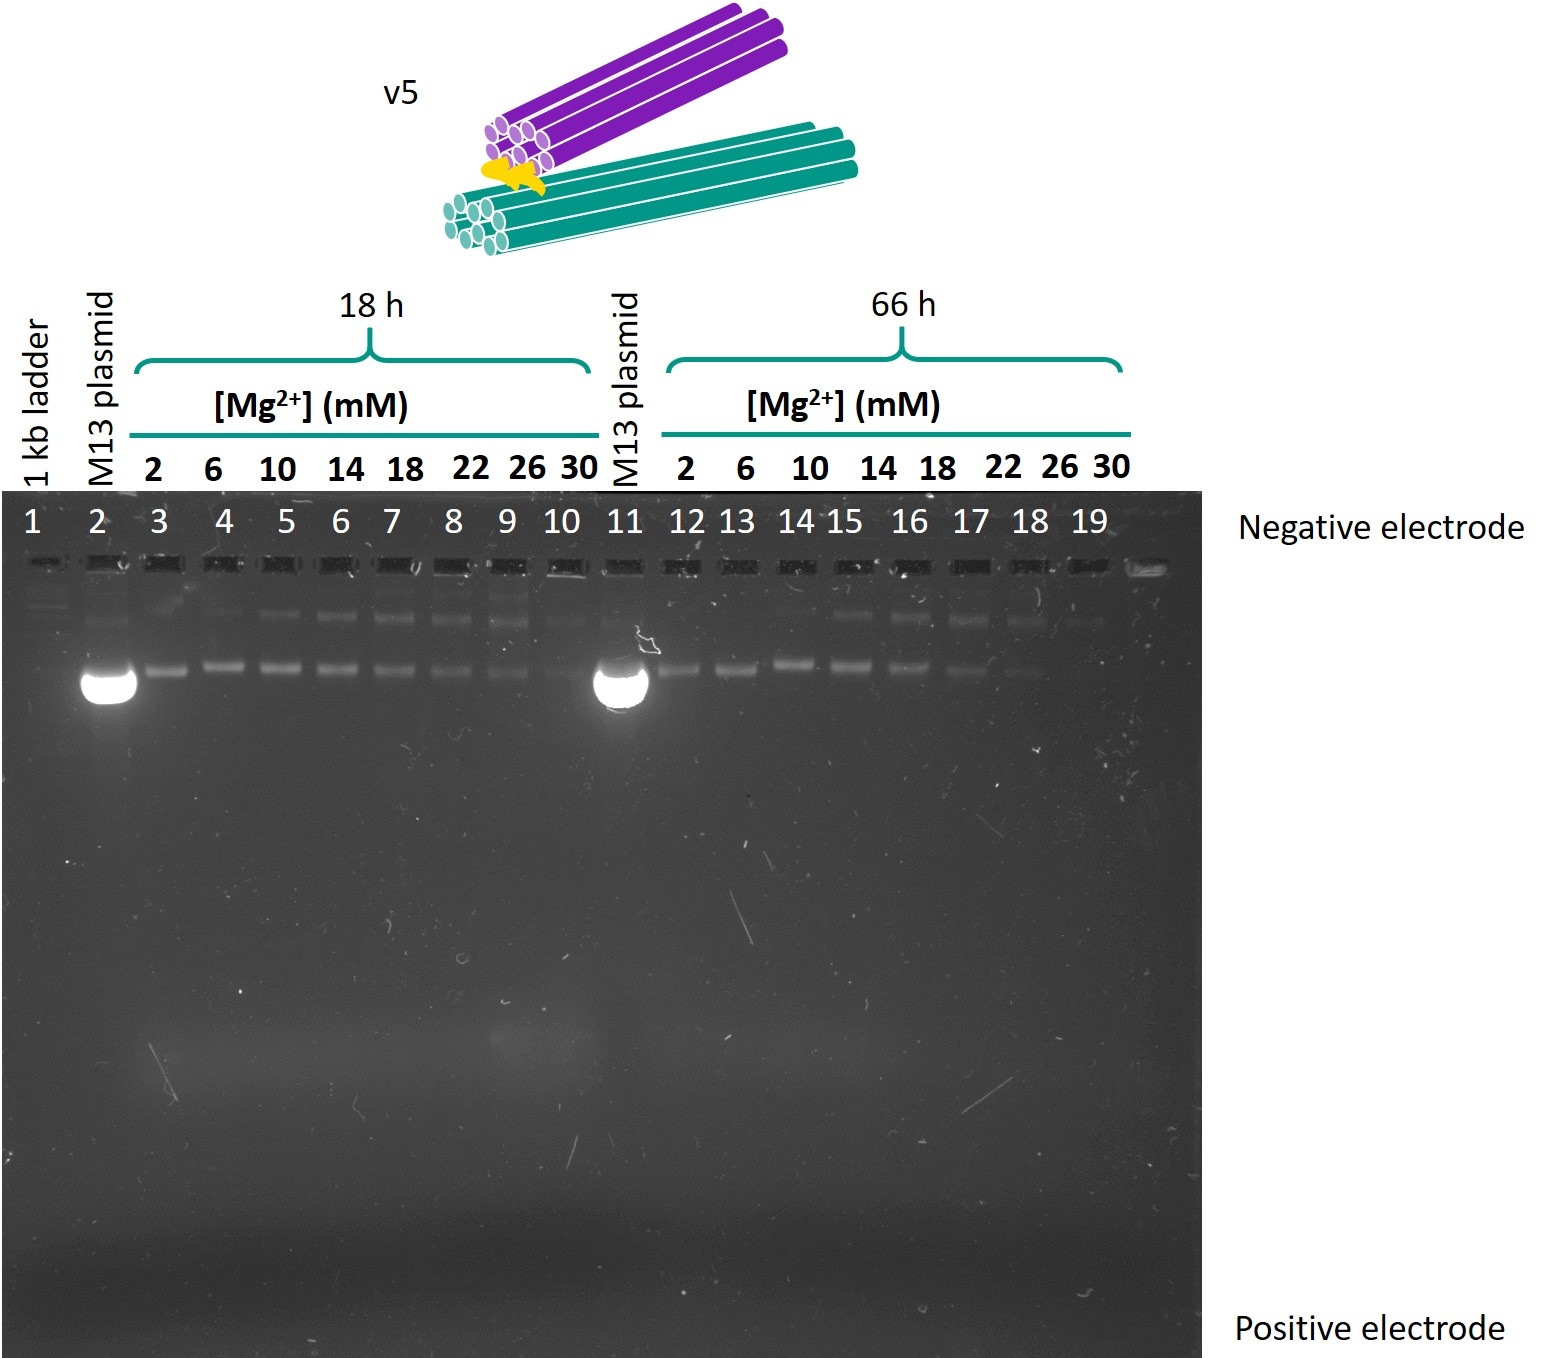
Figure 3: Gel run for version 5 one-way hinge, 24 base hinge.
The optimal folding conditions were found to be 18 h of folding time and 6 or 10 mM Mg2+. Using these folding conditions, the sub-versions with different hinge lengths for each version were folded and run on another gel so as to compare the designs. This gel is shown in Figure 4. The contents of each lane are shown in Table 1.
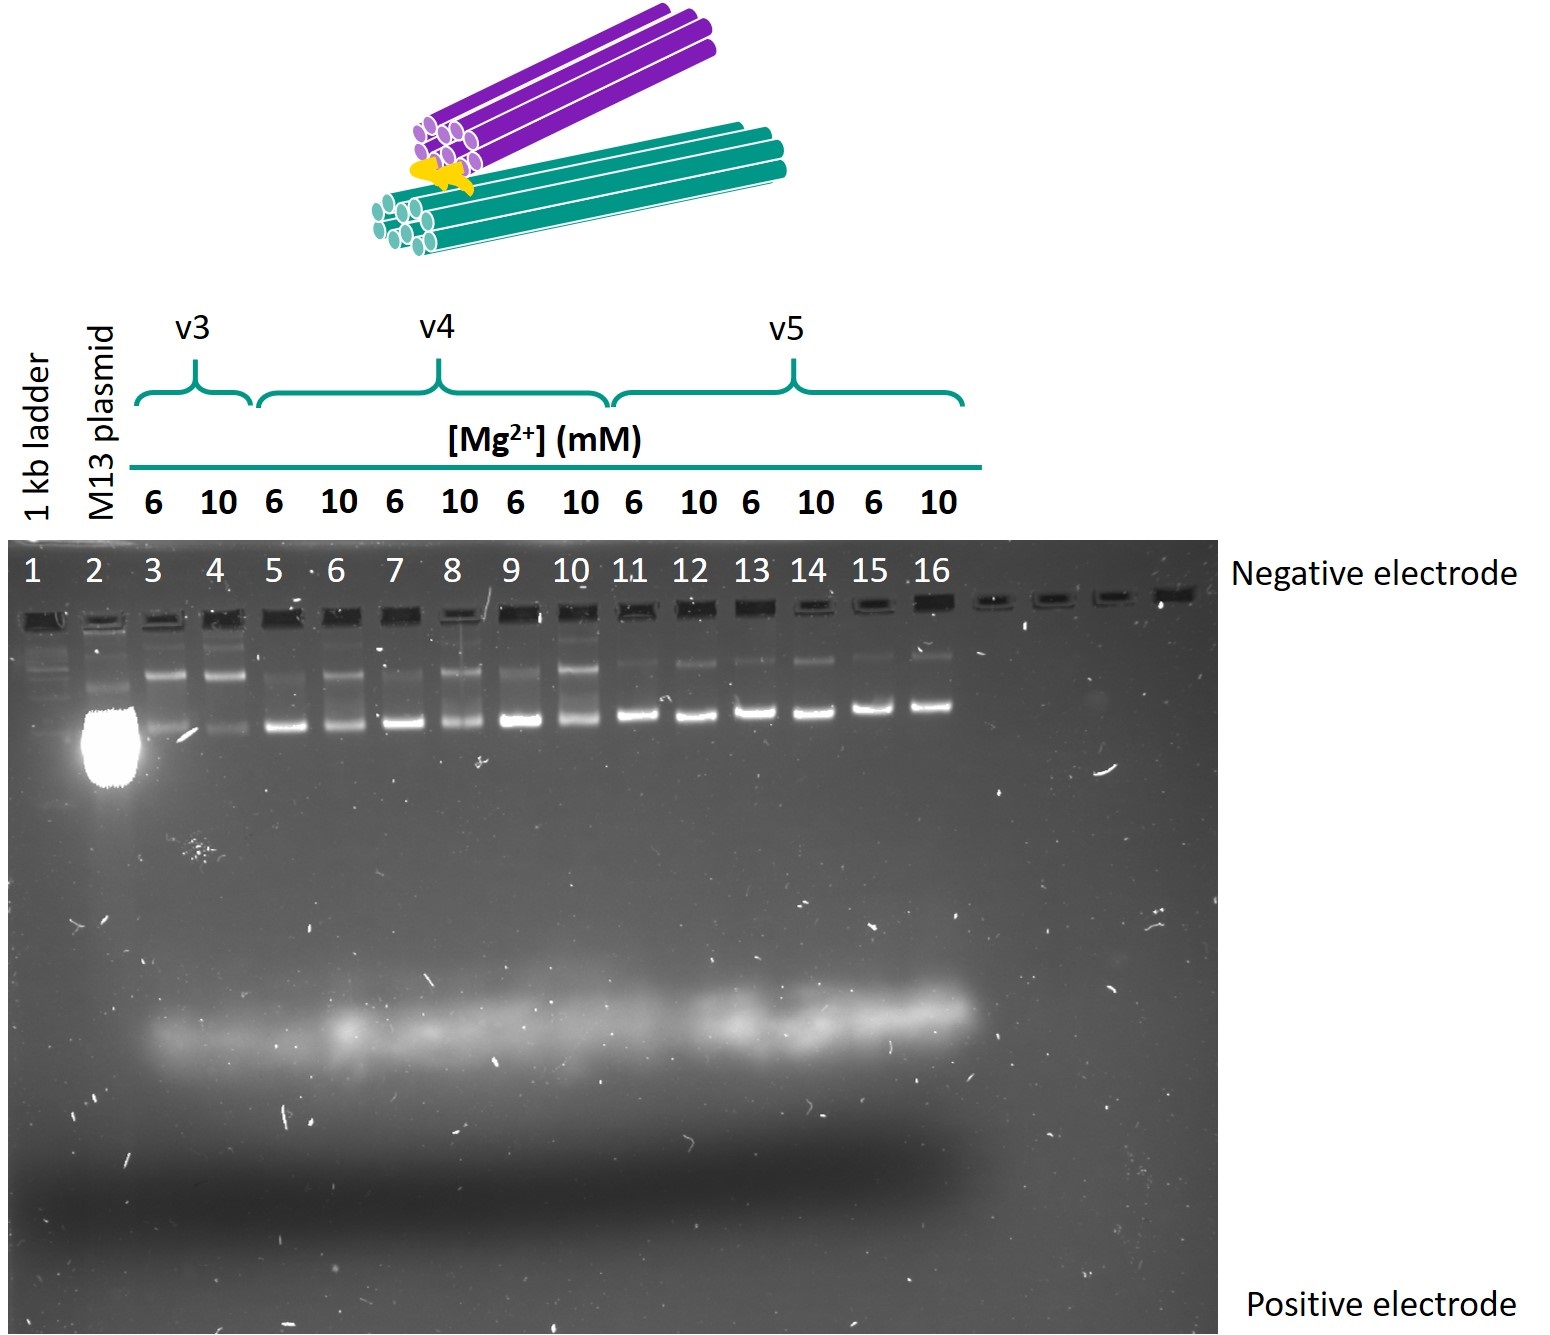
Figure 4: Gel comparing versions 3, 4 and 5 of the one-way hinge, with different lengths of hinges.
Table 1: Contents of lanes in gel shown in Figure 4.
| Lane | Contents | Folding conditions |
|---|---|---|
| 1 | 1 kb ladder | - |
| 2 | M13mp18 plasmid | - |
| 3 | One-way hinge, v3, 24b hinge | 18 h ramp, 6 mM Mg2+ |
| 4 | One-way hinge, v3, 24b hinge | 18 h ramp, 10 mM Mg2+ |
| 5 | One-way hinge, v4, 5b hinge | 18 h ramp, 6 mM Mg2+ |
| 6 | One-way hinge, v4, 5b hinge | 18 h ramp, 10 mM Mg2+ |
| 7 | One-way hinge, v4, 10b hinge | 18 h ramp, 6 mM Mg2+ |
| 8 | One-way hinge, v4, 10b hinge | 18 h ramp, 10 mM Mg2+ |
| 9 | One-way hinge, v4, 24b hinge | 18 h ramp, 6 mM Mg2+ |
| 10 | One-way hinge, v4, 24b hinge | 18 h ramp, 10 mM Mg2+ |
| 11 | One-way hinge, v5, 5b hinge | 18 h ramp, 6 mM Mg2+ |
| 12 | One-way hinge, v5, 5b hinge | 18 h ramp, 10 mM Mg2+ |
| 13 | One-way hinge, v5, 10b hinge | 18 h ramp, 6 mM Mg2+ |
| 14 | One-way hinge, v5, 10b hinge | 18 h ramp, 10 mM Mg2+ |
| 15 | One-way hinge, v5, 24b hinge | 18 h ramp, 6 mM Mg2+ |
| 16 | One-way hinge, v5, 24b hinge | 18 h ramp, 10 mM Mg2+ |
From this gel, the optimal design parameters were identified as 1-2 scaffold crossovers and 3-4 staple crossover per pair of adjacent helices, and hinges 10 bases in length.
Figure 5 shows the gel in which the folded samples of version 6 were run.
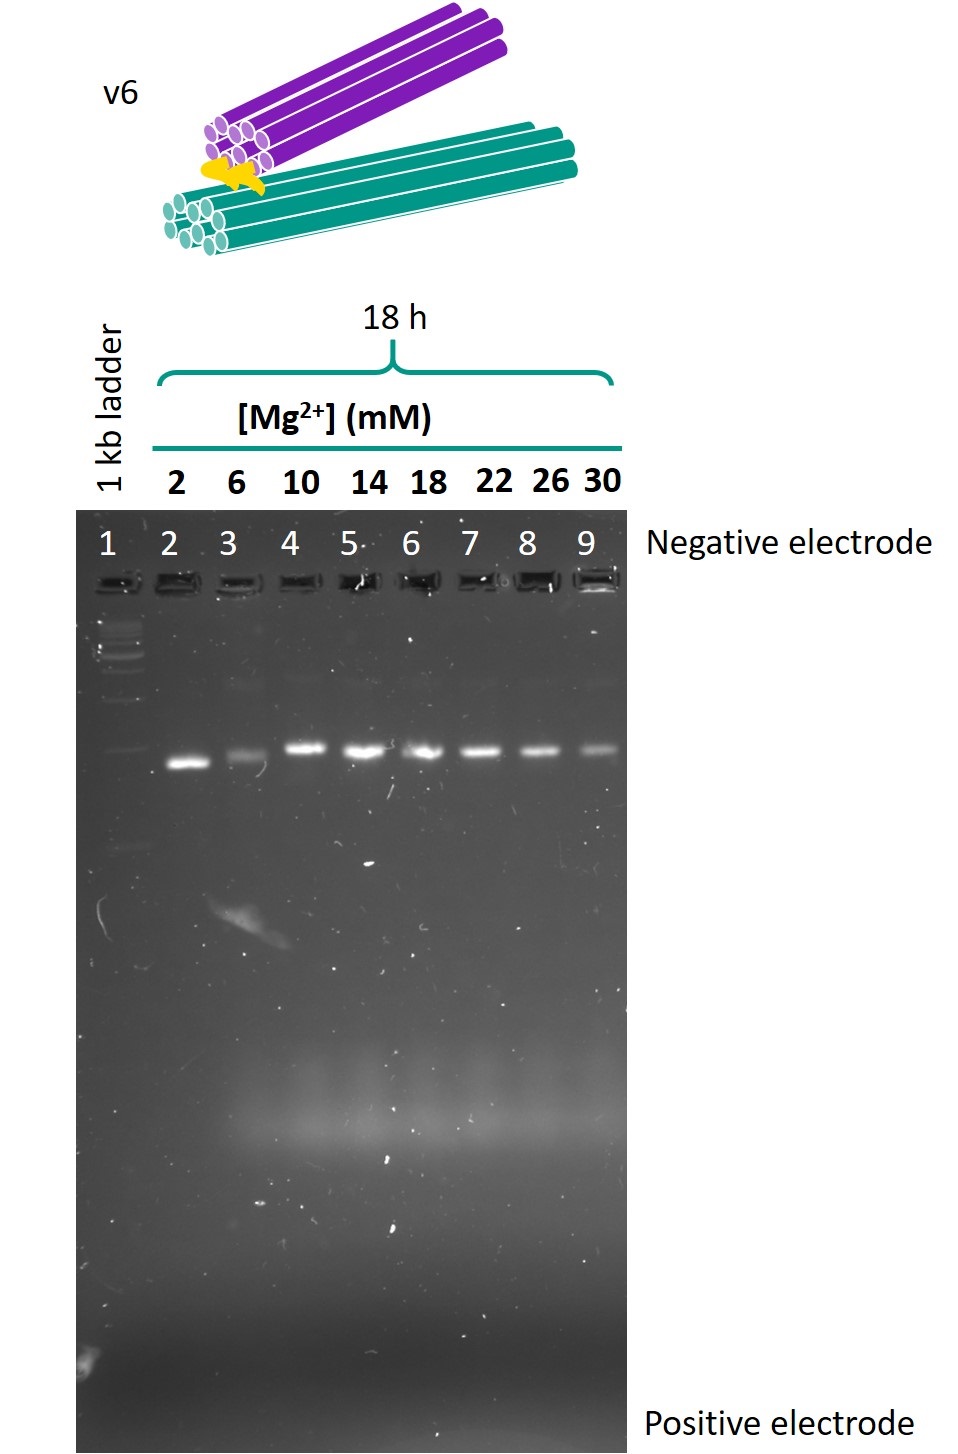
Figure 5: Gel run for version 6 one-way hinge.
Figure 6 shows the gel in which the folded samples of version 8 were run.
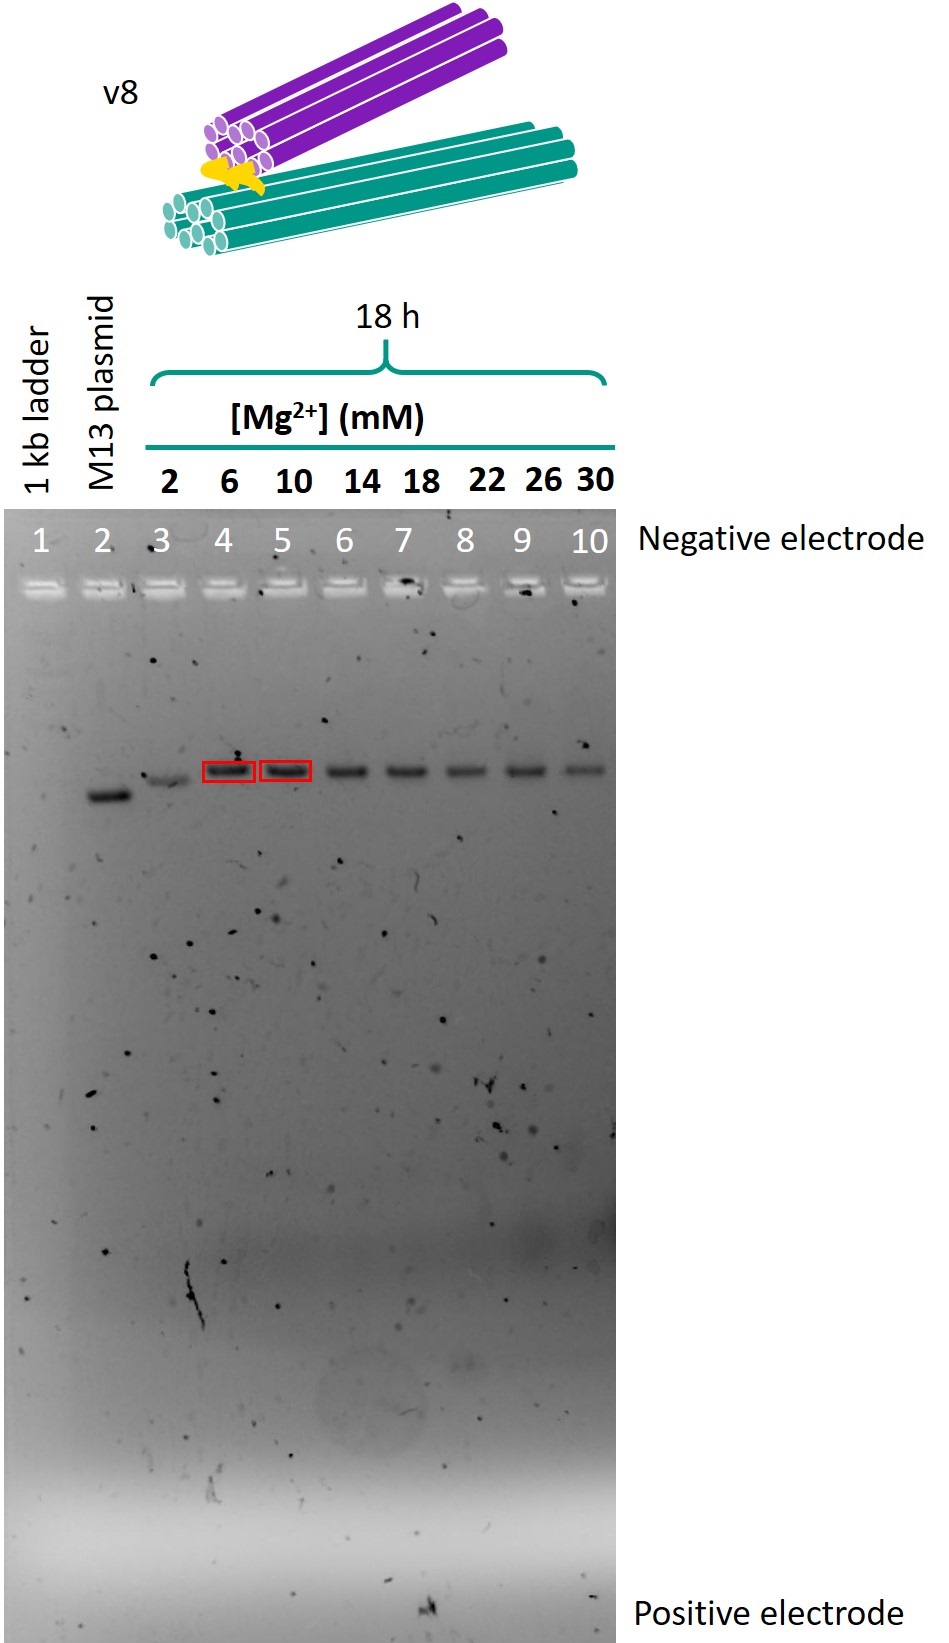
The bands in lanes 4 and 5 of the gel shown in Figure 6 were excised and the DNA was extracted. TEM was used to image these samples.
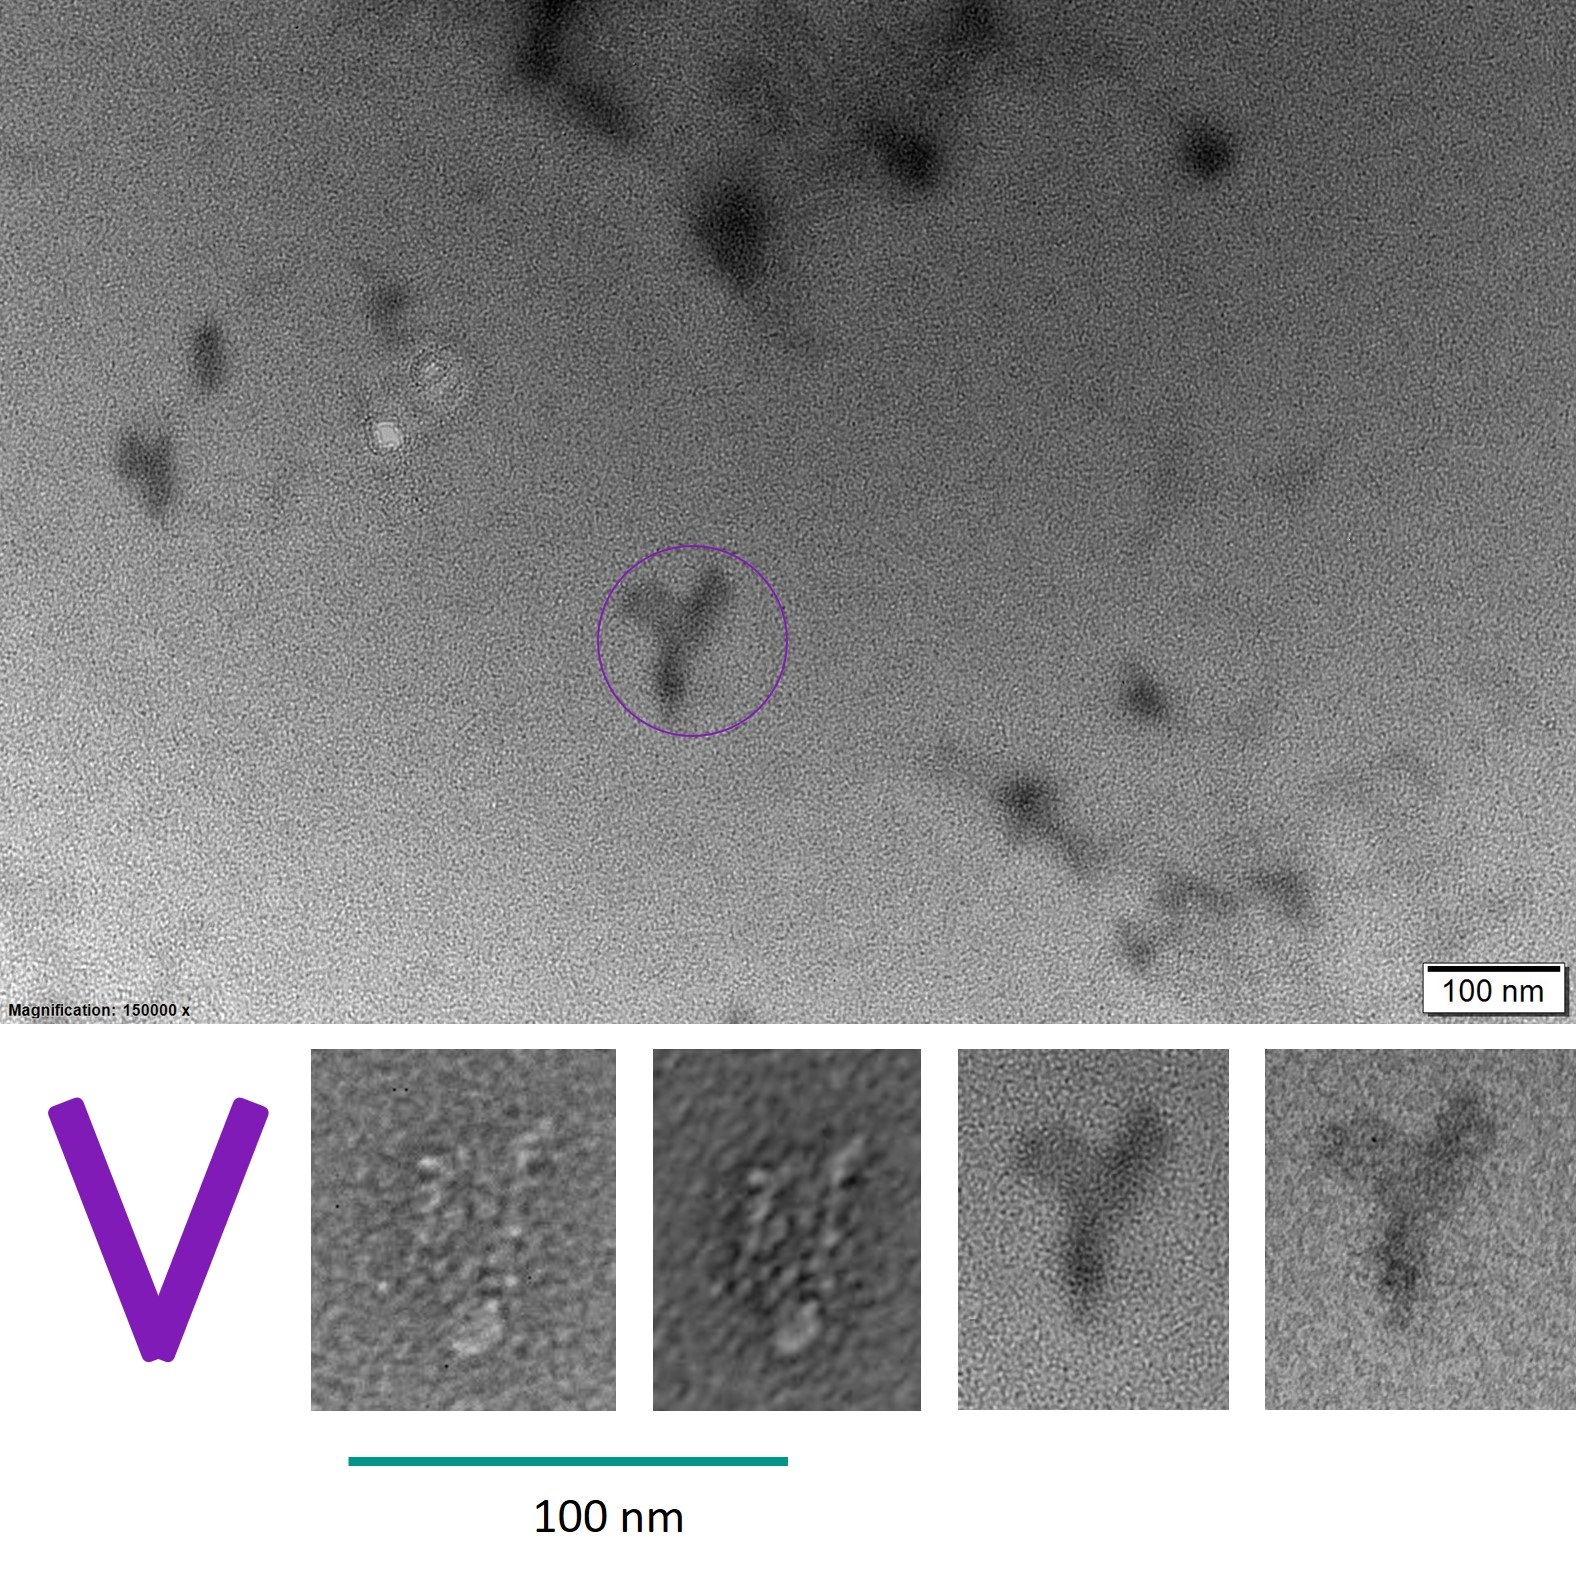
Figure 7: TEM images of purified version 8 one-way hinge.
For all TEM images taken of the one-way hinge origami, click here.
Discussion
For each of the gels, many samples produced two bands. The lower bands, which migrated a similar distance to the M13mp18 scaffold, were identified as the intended origami, while the upper bands were identified as dimers of the origami. To prevent dimerisation in later stages, we added 5 thymine nucleotides (TTTTT) to the ends of the structures. The presence of non-complementary sticky ends on the edges of the structure should reduce the risk of structures becoming attached to each other.
The samples folded in 6 mm Mg2+ or 10 mm Mg2+ produced lower bands that were both of relatively high intensity and migrated the furthest. Hence, these Mg2+ concentrations were identified as the optimal concentrations for folding. There was little difference between the 18h and 66h folds in terms of band migration, which was as expected as the temperature ramp should only affect the yield, but not the structure of the origami produced. In view of the limited timeframe for experiments, the 18h temperature ramp was chosen as the optimal folding condition.
When the sub-versions with varying hinge lengths were compared (Figure 4), for version 4, all the lower bands migrated the same distance, but the sub-version with 10 base hinge produced a more intensely coloured band. This suggested that the 10 base hinge sub-version had the least dimerisation and the highest yield. A similar observation was made for version 5. Comparing versions 4 and 5, the lower bands representing the intended origami in version 5 were more intensely coloured than the dimerisation bands, whereas the intended and dimerisation bands were of equal intensity in version 4. This suggests that version 5, which has less scaffold crossovers, is more optimised for folding and will give a higher yield. Hence, the optimal design parameters were identified as 10 base hinges, and 1-2 scaffold crossovers and 3-4 staple crossovers per pair of adjacent helices.
In the TEM images, structures were identified which had a similar shape and size to the one-way hinge that was designed. This suggests that the version 6 one-way hinge was folded successfully. It is also notable that in all the images where the one-way hinge was identified, the angle between the arms was small, with an average of about 30°. This confirms that having an extension on one arm of the one-way hinge is able to restrict the angles that the hinge can take, as designed.
Conclusions
In conclusion, the optimal design parameters and folding conditions for the one-way hinge were identified. The one-way hinge was successfully folded and imaged, and the images suggest that the angles between the arms of the one-way hinge are restricted to less than 180° as planned.
Stage 3: Designing a full square twist
Having designed the one-way hinge, we wanted to construct the full square twist out of DNA. Due to limits on the size of the scaffold, the folding pattern of the square twist was divided into 1 central square component and 4 peripheral components, each of which could then be constructed as individual DNA origami. The staples for the peripheral module were pooled with plasmid and varying concentrations of Mg2+, and incubated for 18h. The resulting origami was purified by agarose gel electrophoresis and imaged by TEM. |
Introduction
In the Design phase, we divided the folding pattern of the square twist into a central square component and 4 peripheral components.
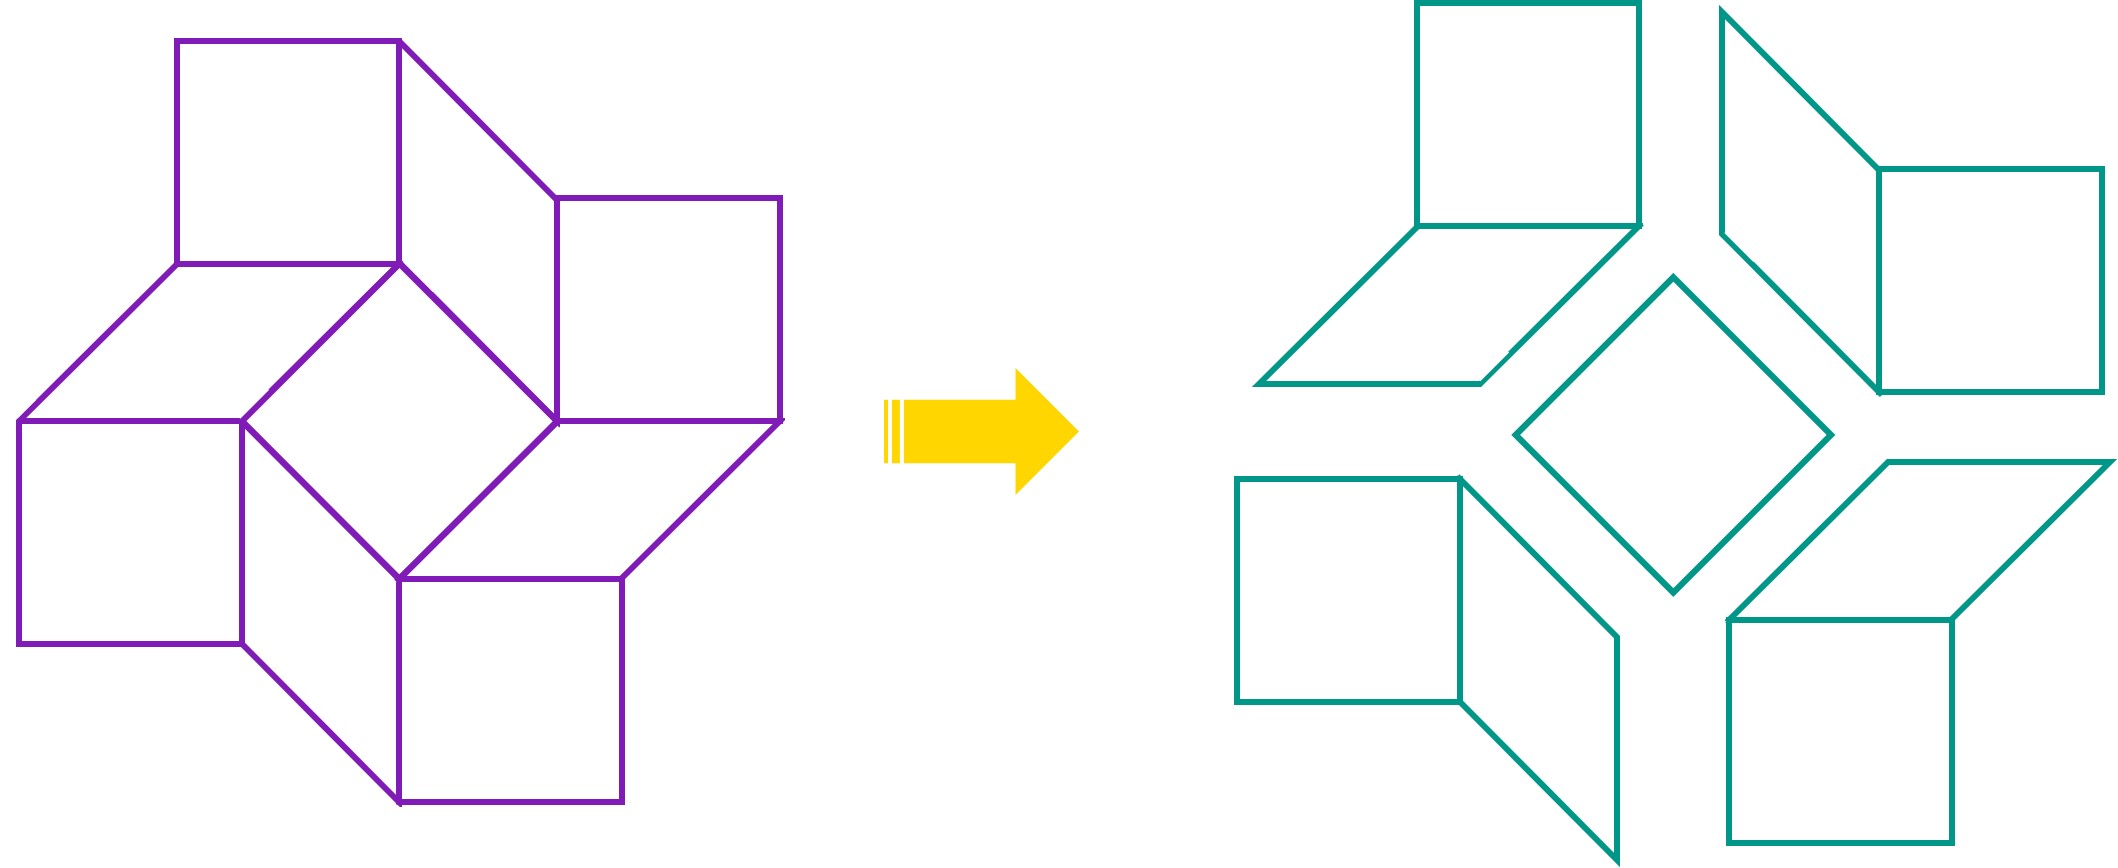
We then designed the staples needed to form one of the peripheral modules. To investigate whether our design would fold and yield the intended module, we pooled the staples with M13mp18 plasmid and allowed the DNA to fold. The products were purified by agarose gel electrophoresis and imaged by TEM.
Aim
This experiment aimed to fold the peripheral module of the square twist, and image it with TEM to confirm that it had been successfully folded.
Methods
The same protocols for folding and agarose gel electrophoresis as Stage 2 were used. A folding mixture was prepared, containing the M13mp18 scaffold at a concentration of 10 nM, staples for the peripheral module at a concentration of 100 nM, and varying Mg2+ concentration. The folding mixtures were heated to 65°C for 15 min, and then cooled to 25°C over 18 h. 4 μL of loading dye was added to 20 μL of each product, and 20 μL of this mixture was loaded into a 2% agarose gel. The gel was run in 0.5x Tris/Borate/EDTA (TBE) buffer (11 mM MgCl2) at 60 V for 4 h, stained with Sybr Safe (a DNA stain) and visualized under UV light. DNA was extracted from the bands to yield the purified module, which was then imaged by TEM.
Results
Figure 8 shows the gel in which the folded samples of the module were run.
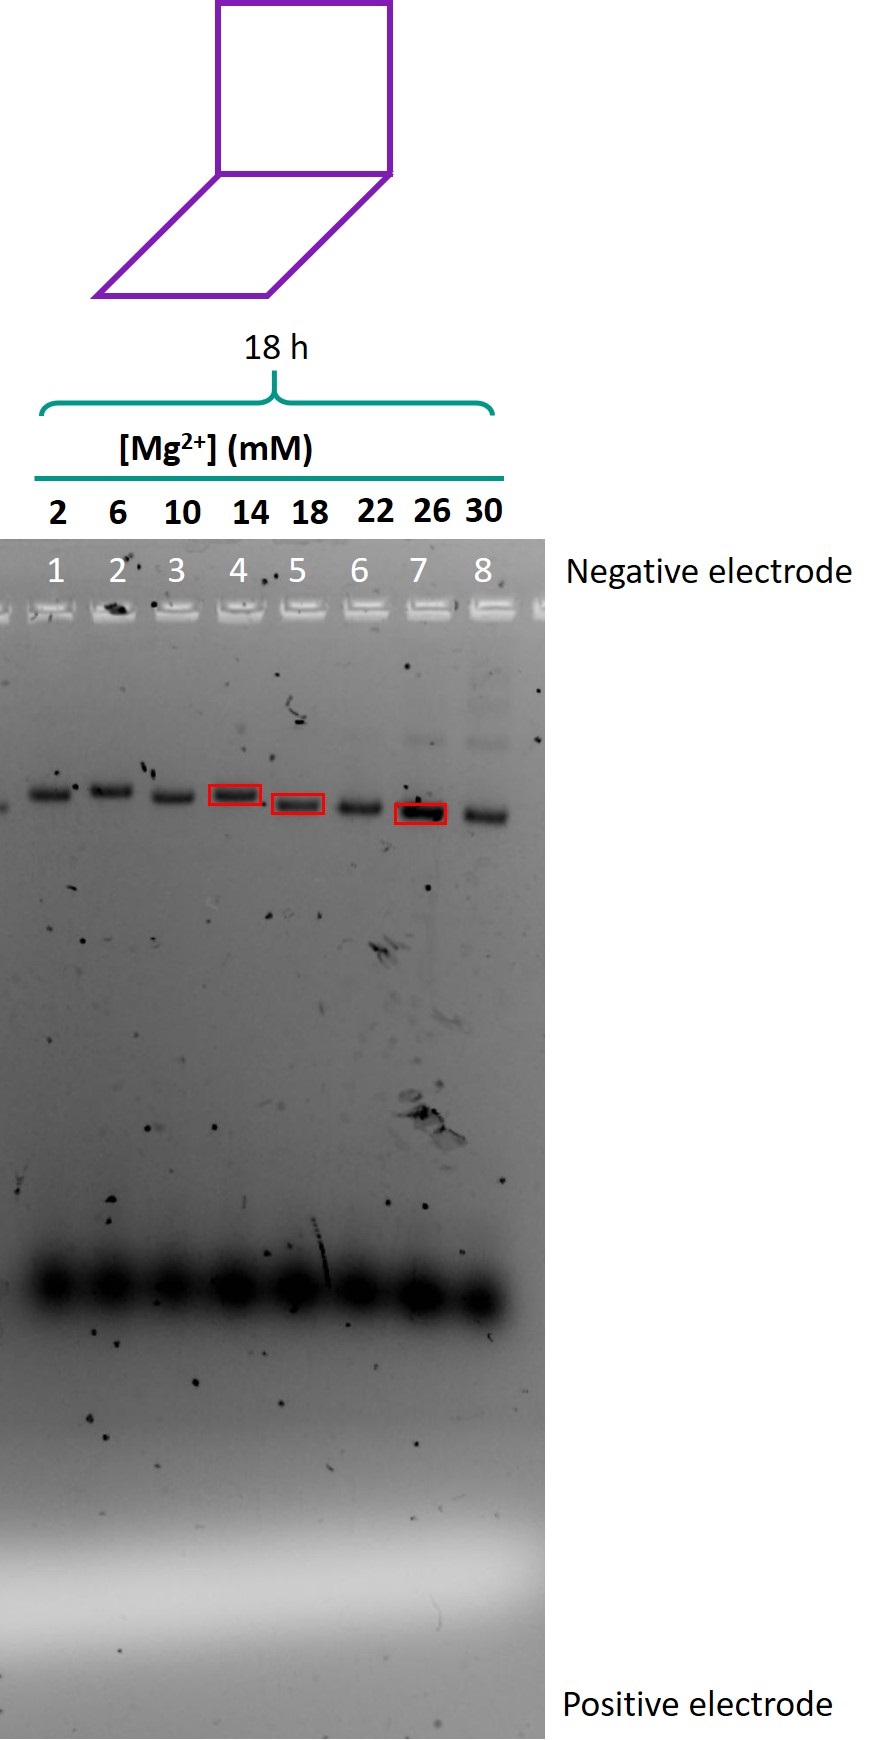
Figure 8: Gel run for the modular origami.
The bands shown in lanes 4, 5 and 7 of Figure 8 were excised and the DNA was extracted. TEM was used to image these samples.
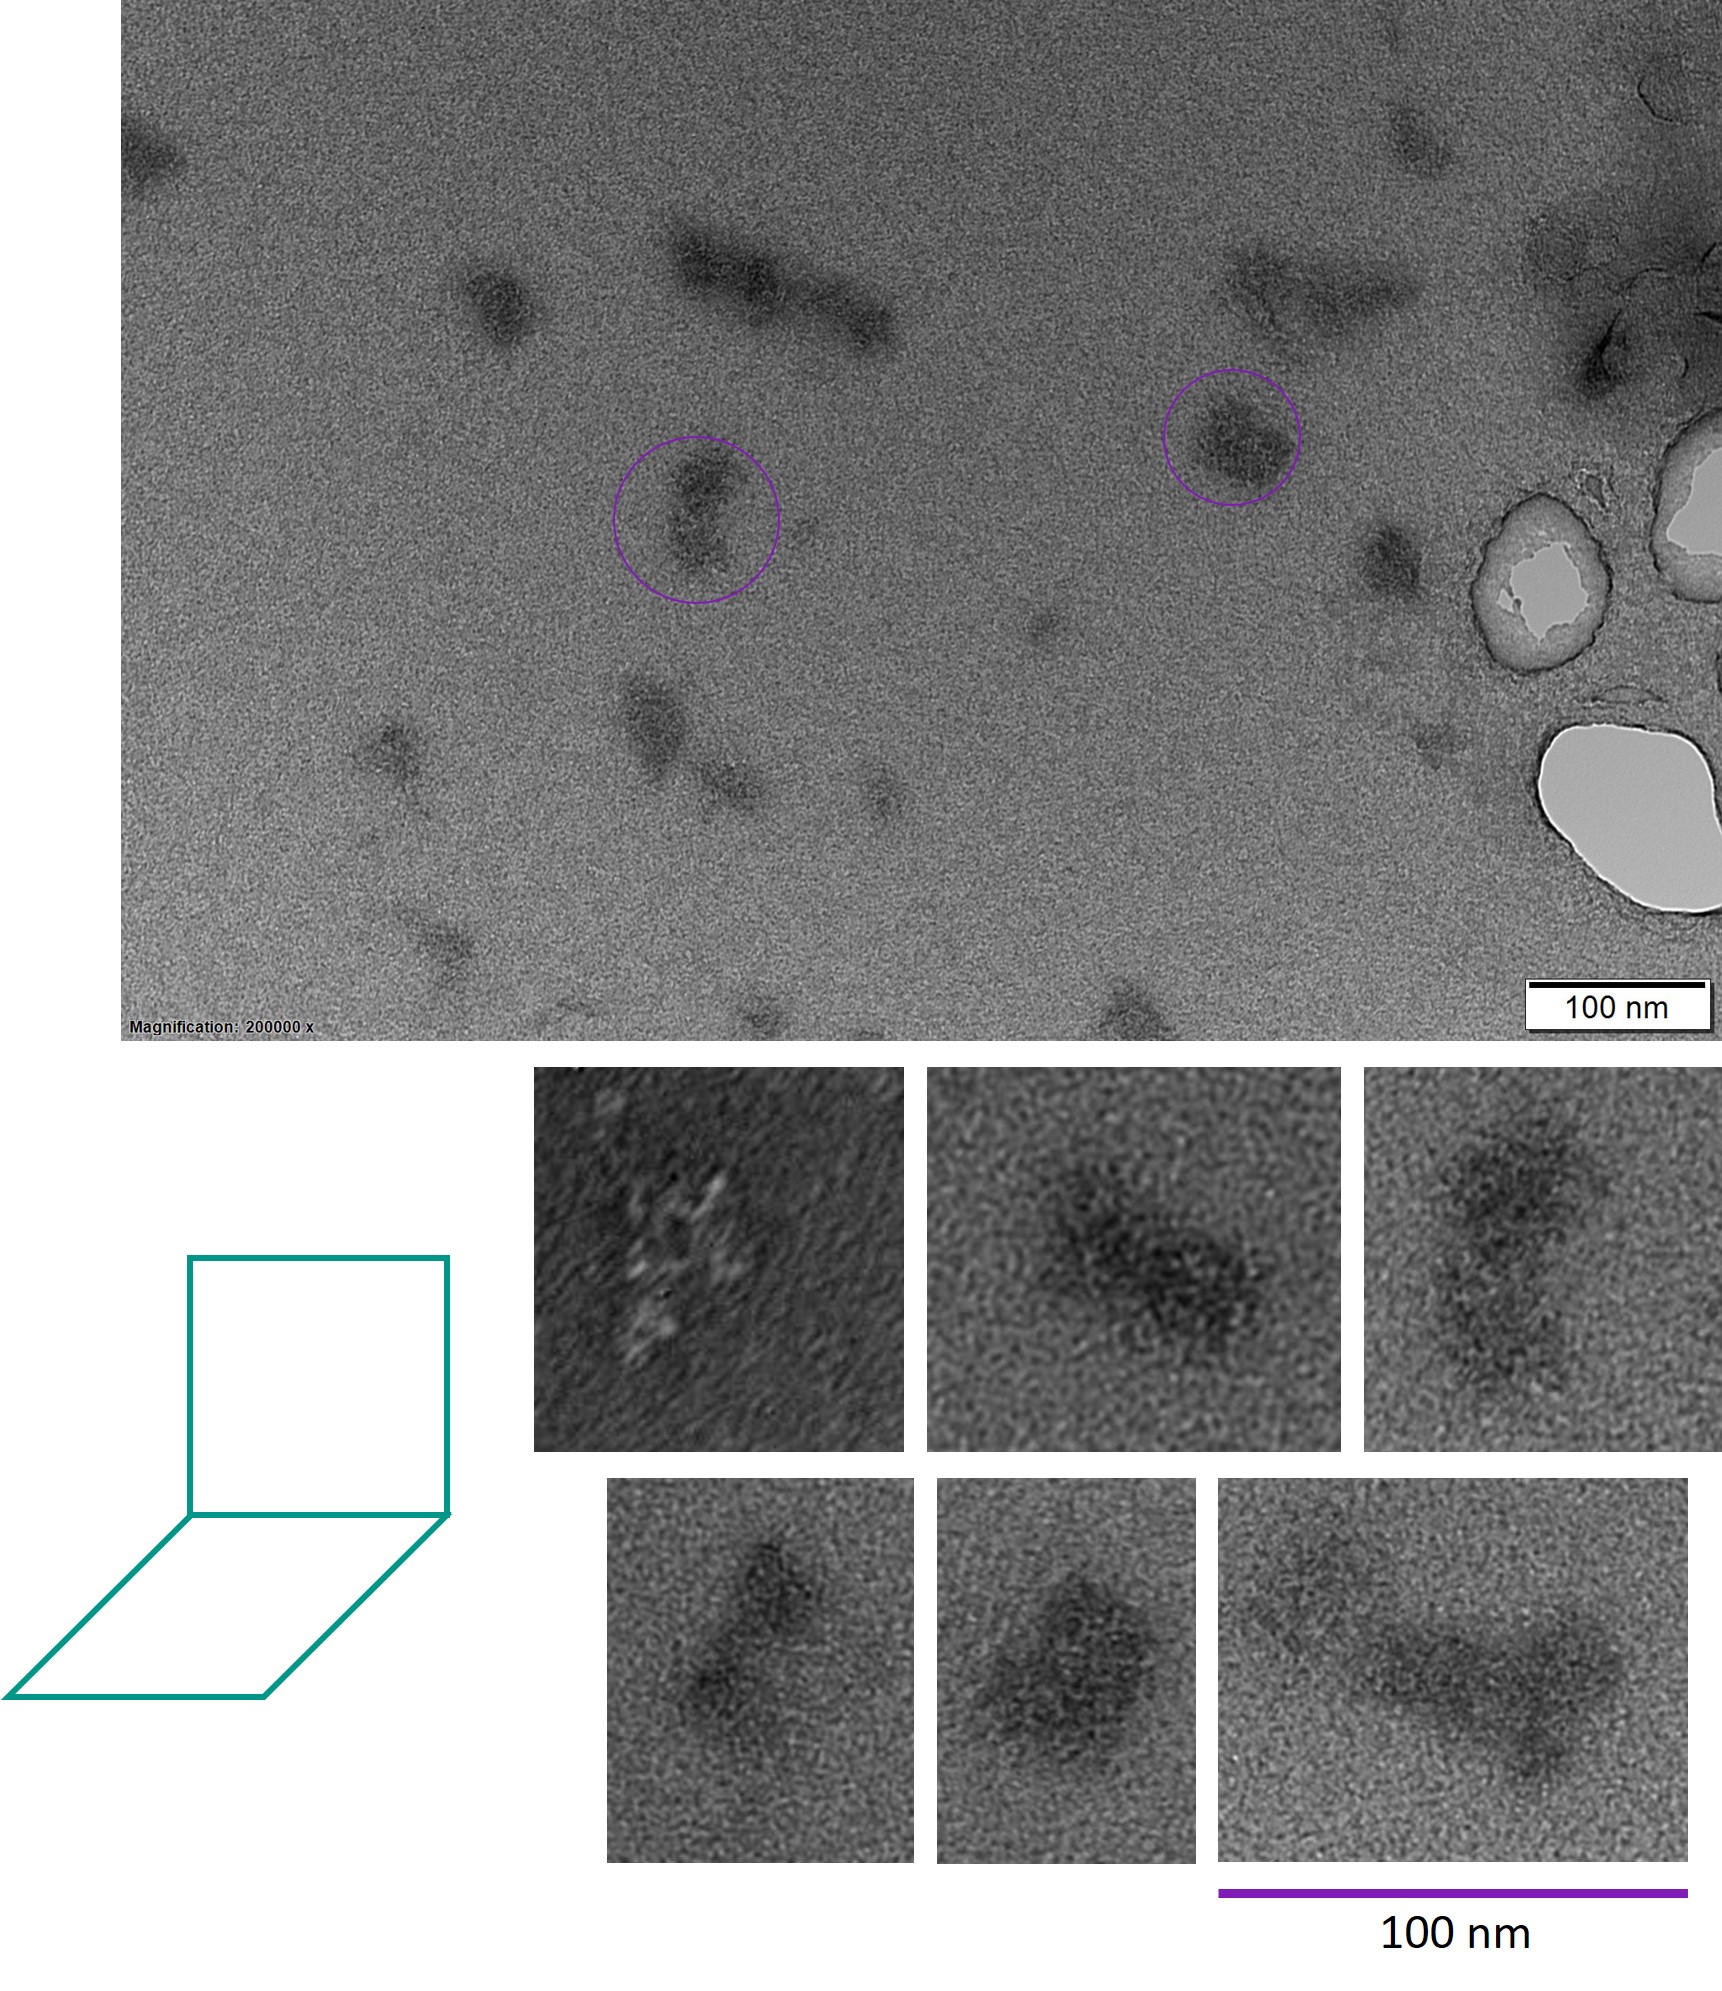
Figure 9: TEM images of the square twist module.
For all TEM images taken of the module, click here.
Discussion
Although the concentrations of staples and plasmid were the same as in previous experiments, in the gel, the smeared band near the bottom of the gel representing excess staples was of much higher intensity than previous gels. This suggests that most of the staples were not incorporated into the structure, and that the structure did not fold successfully.
The TEM images also suggested incomplete folding. Most structures were indistinct, and very few had a structure similar to what was intended. Many structures were square-shaped, but lacked the rhombus part of the module. It is likely that due to the differences in scaffold routing in the square and rhombus parts of the module, the square part was able to fold but not the rhombus part. Hence, further research into the formation of the rhombus section, or an alternative design, is recommended.
Conclusions
The current design was able to fold into the square part of the intended square twist module successfully, but not the rhombus part. An alternative design should be tested to obtain the intended shape.
Stage 4: Demonstrating trigger-induced folding
For our detection system to function, the trigger created by the amplification system must be able to cause a conformational change in the square twist. The trigger binds to the brace complement, leaving the brace single-stranded to preferentially form into a hairpin. This provides the driving force for the conformational change of the DNA device. We designed a brace and brace complement, and tested the ability of the brace to close a one-way hinge. |
Introduction
We previously designed a brace that would fold into a hairpin when single-stranded, a brace complement, and a trigger strand. To test whether the trigger was capable of forming a hairpin and inducing a conformational change in a DNA structure, we attached the brace to version 6 of the one-way hinge, and used TEM to observe whether addition of the trigger strand was able to close the hinge.
Aim
This experiment aimed to identify whether addition of the trigger strand to a one-way hinge held open with a brace was able to close the hinge.
Methods
The same protocols for folding and agarose gel electrophoresis as Stage 2 were used. A folding mixture was prepared, containing the M13mp18 scaffold at a concentration of 10 nM, staples for version 6 of the one-way hinge at 100 nM, the brace and brace complement at 100 nM each, and varying Mg2+ concentration. The folding mixtures were heated to 65°C for 15 min, and then cooled to 25°C over 18 h. 4 µL of loading dye was added to 20 µL of each product, and 20 µL of this mixture was loaded into a 2% agarose gel. The gel was run in 0.5x Tris/Borate/EDTA (TBE) buffer (11 mM MgCl2) at 60 V for 4 h, stained with Sybr Safe (a DNA stain) and visualized under UV light. DNA was extracted from the bands to yield the purified one-way hinge in its open conformation.
To half of the purified samples, 1 µL of trigger strand (1 µM) was added. The samples were stored overnight to allow the trigger strand to bind to the brace complement and induce conformational change from open to closed.
The open and closed forms of the one-way hinge were then imaged by TEM.
Results
Figure 10 shows the gel in which the folded samples of the module were run.
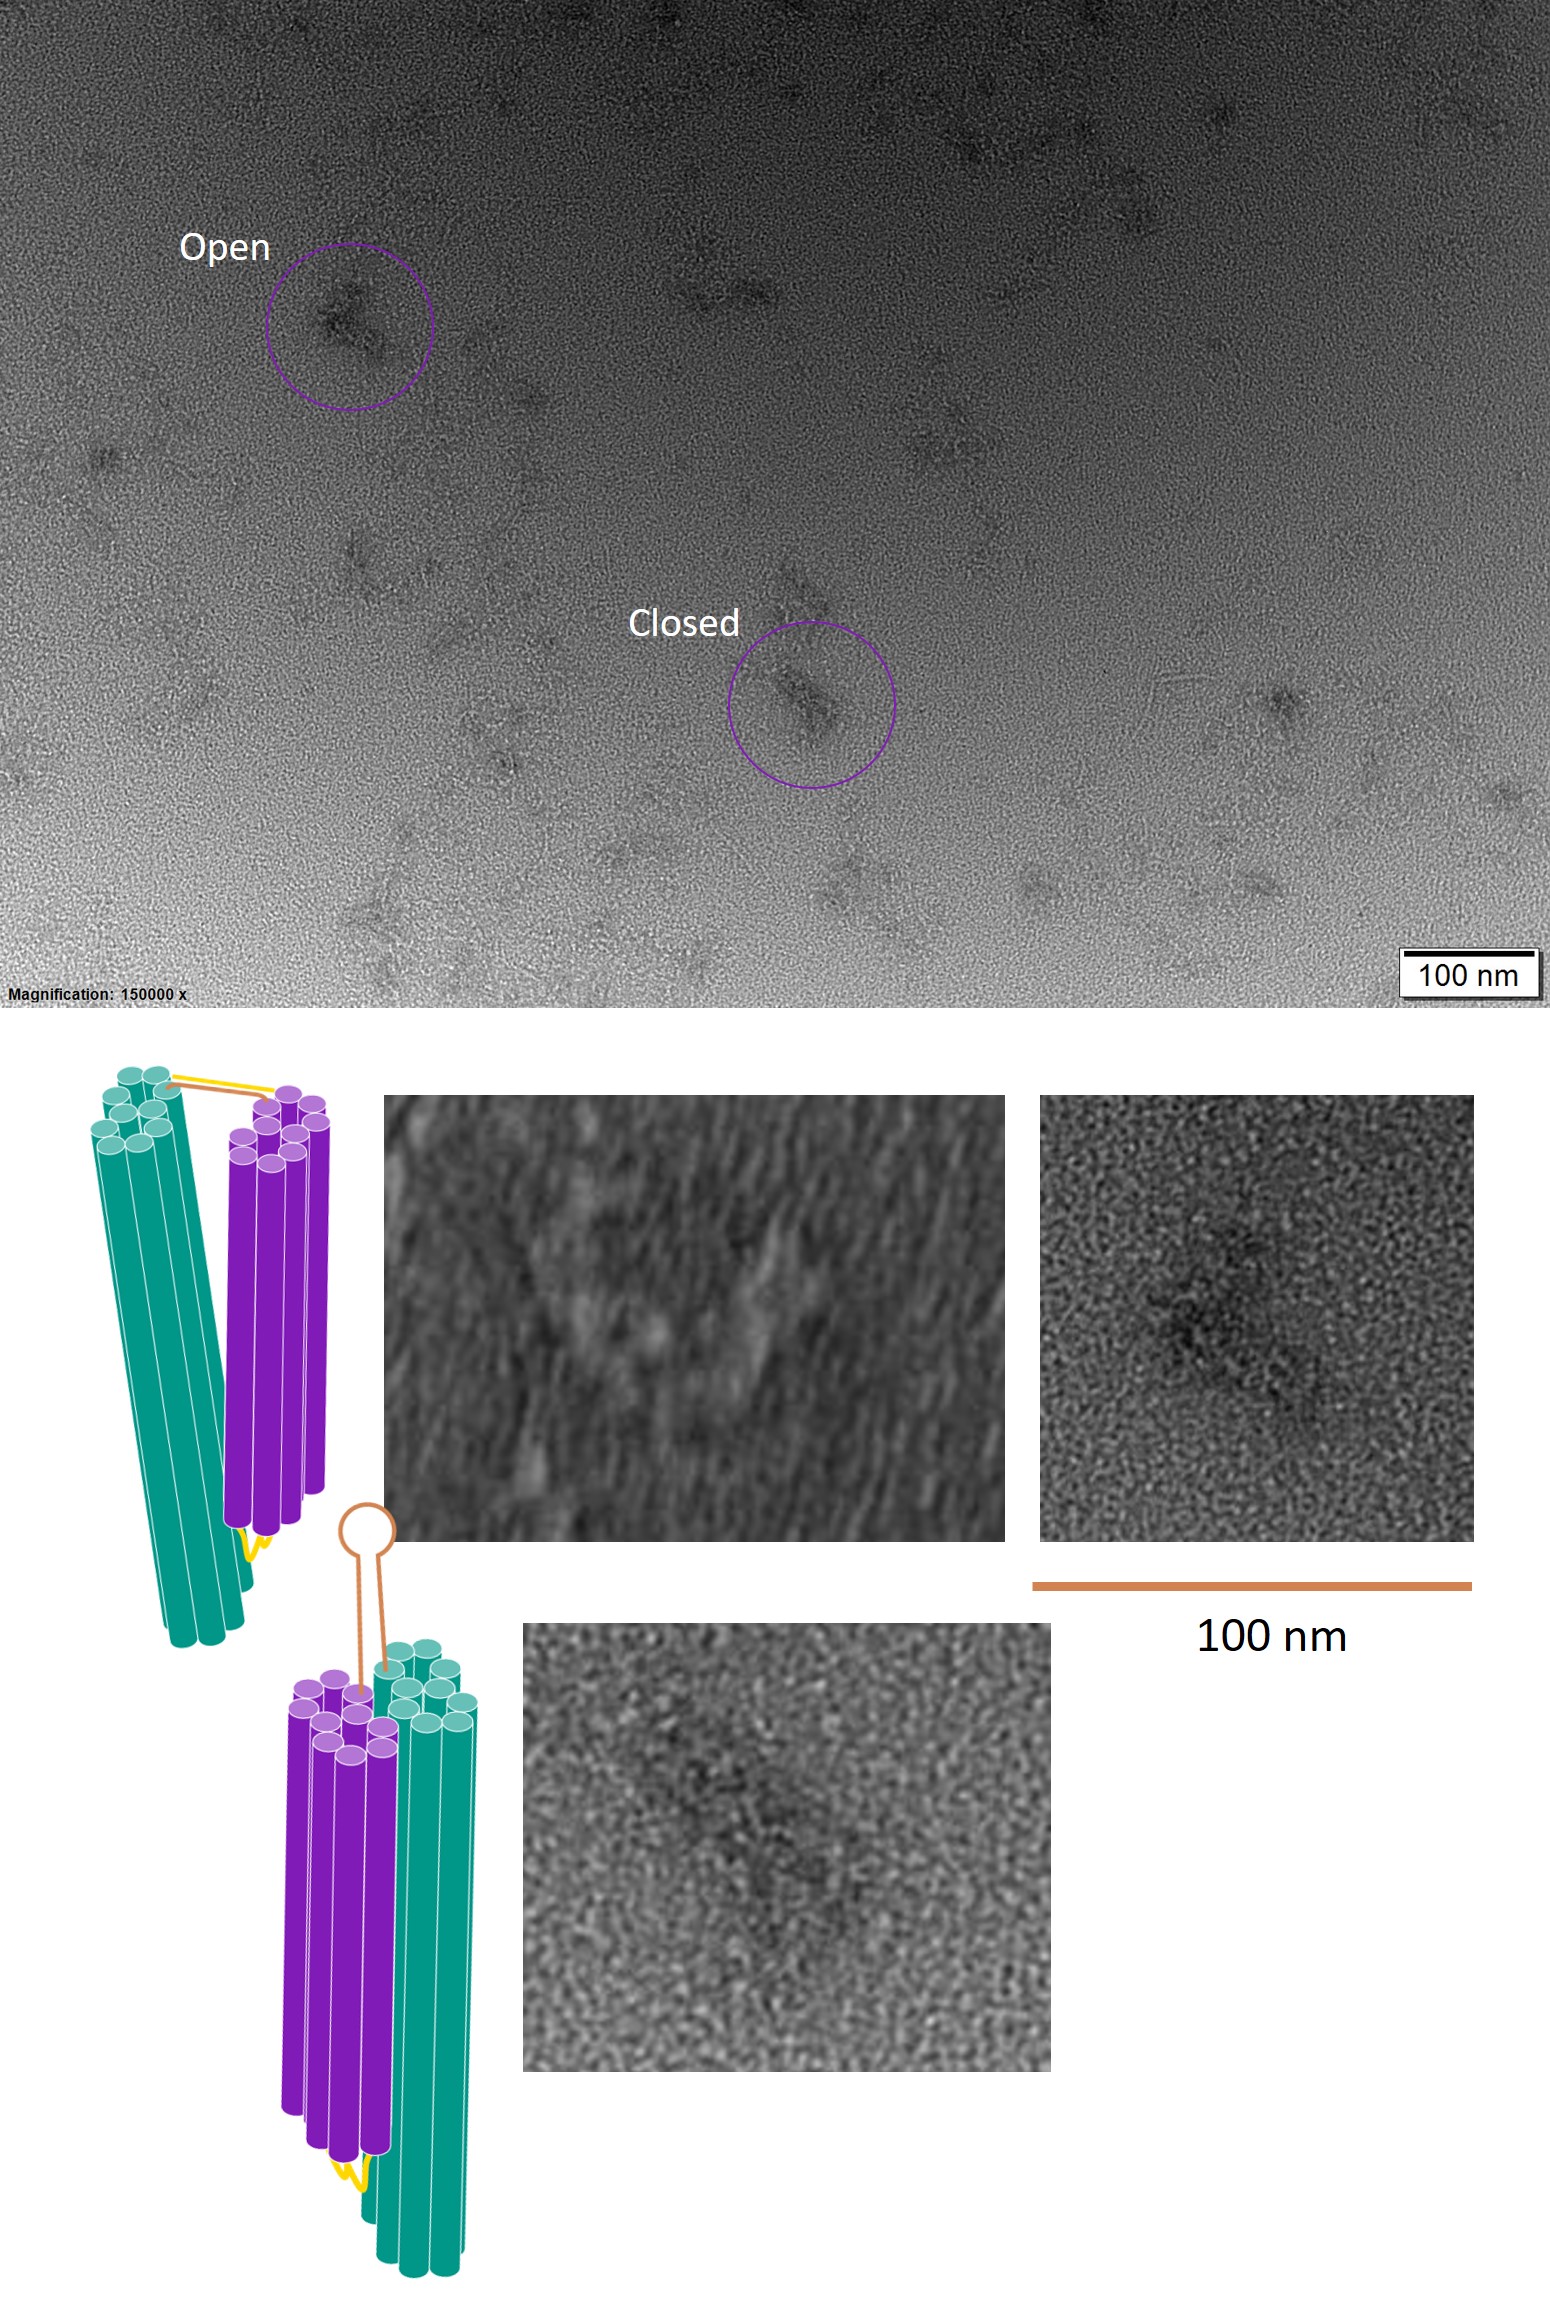
Figure 10: Gel run for version 6 one-way hinge, with brace.
The bands shown in lanes 4 and 5 of Figure 10 were excised and the DNA was extracted. The trigger strand was added to half of the sample from each lane, and TEM was used to image these samples.
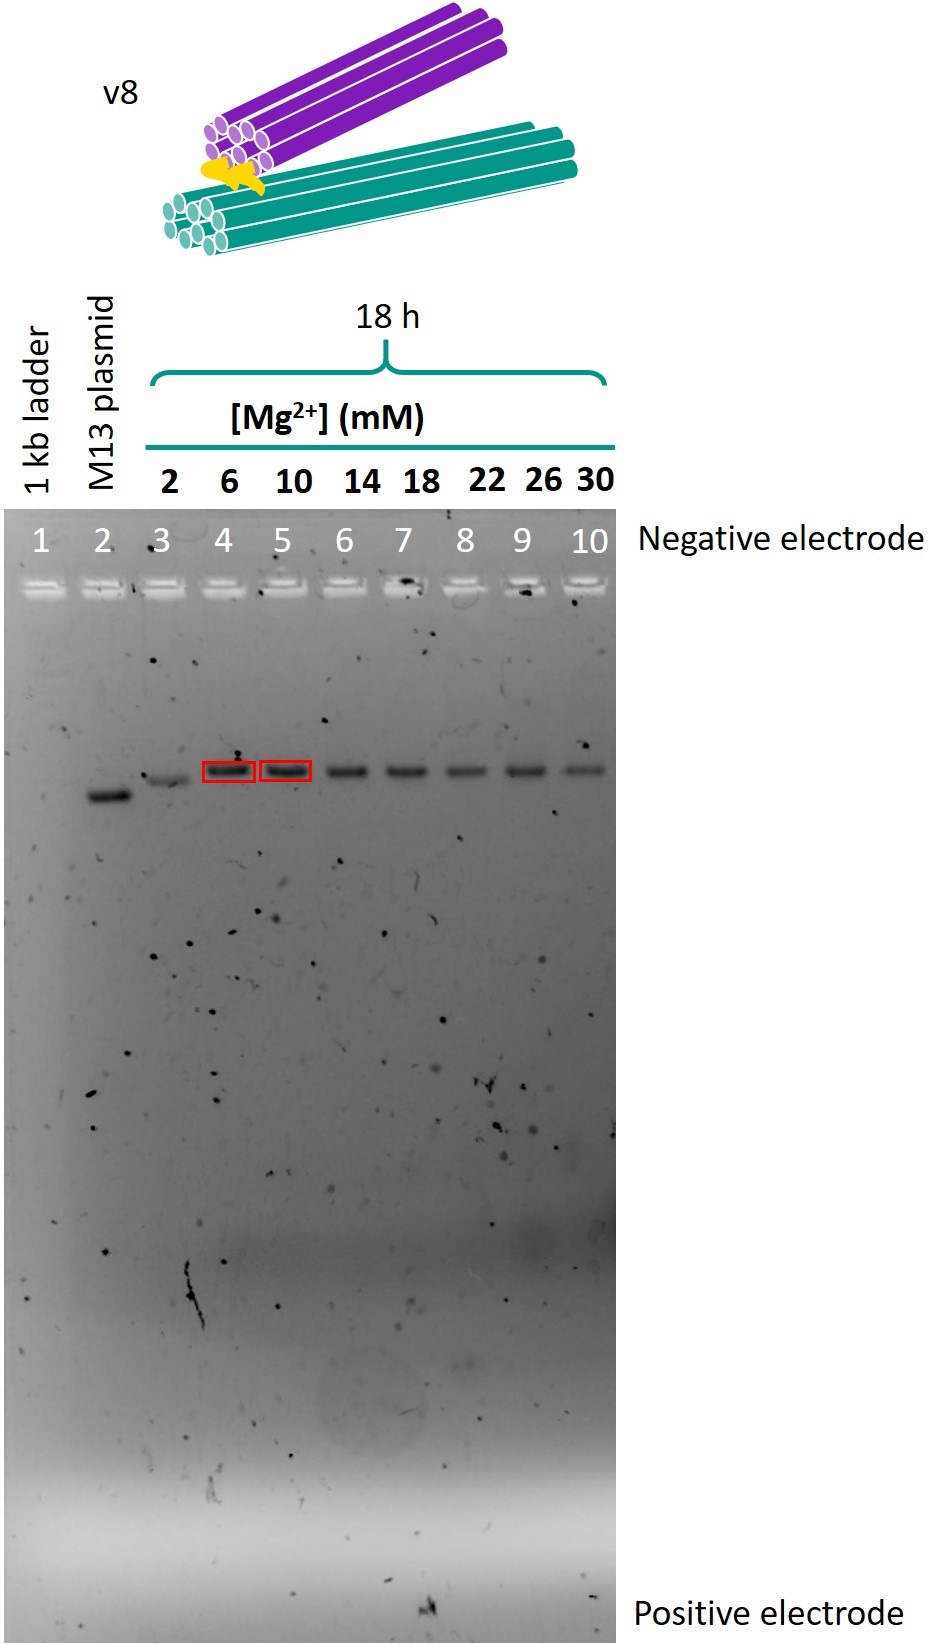
Figure 11: TEM images of the one-way hinge, version 6, in open and closed conformations.
Discussion
In the TEM images, the one-way hinge was successfully identified in both open and closed conformations. This suggests that addition of the trigger strand was indeed able to displace the brace complement, allow the brace to form a hairpin and change the conformation of the one-way hinge. However, the presence of both the open and closed forms in the same image suggests that although the trigger strand was added in excess, not all the hinges were closed. While this is not an issue at this stage, it may be necessary to quantify the number of hinges that can be induced to close for a given amount of trigger strand in later stages, to test the sensitivity of the detection system.
Conclusion
In conclusion, addition of a brace and brace complement to the one-way hinge held the hinge in open form, and addition of the trigger was able to induce a conformational change from open to closed. Hence, the brace and trigger are suitable as a mechanism to close the square twist upon introduction of viral DNA.
References
- Sobczak J-PJ, Martin TG, Gerling T, Dietz H (2012). Rapid folding of DNA into nanoscale shapes at constant temperature. Science 338: 1458-1461.
- Miduturu, C.V., Silverman, S.K. (2006). Modulation of DNA constraints that control macromolecular folding. Angew. Chem. Int. Ed., 45: 1918-1921.