New DNA origami structure the DNAlien was designed featuring a nanopore tethered inside a barrel
TEM confirmed folding of DNAlien and that pore can exist in different states
DNA strand displacement switches for changing the nanopore state were designed, and validated by PAGE gel, and are ready for use with the DNAlien
Folding for four helix-bundle (4HB) nanopore was optimised and the 4HB was shown to facilitate transmembrane transport of protons
A new six helix-bundle (6HB) featuring a larger pore diameter was designed and folded
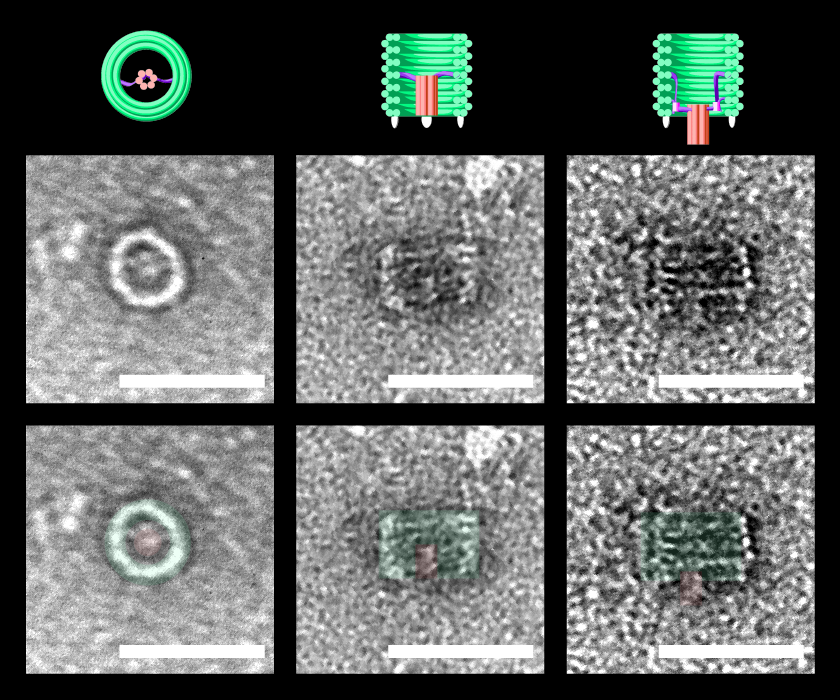
Figure 0. TEM images of the DNAlien folded with a central pore. DNAlien model (top row), TEM images (central row) and TEM with false colour to highlight key features (bottom row, green barrel and red pore). Images are shown for top view (left), and side views (centre, right). Unlocked pores were observed in a range of different states (side view), including both the closed (middle) and open position (right). Thus, the pore can move on the flexible tether and occupy a range of states. Further work will involve showing controlled switching between these states. Scale bars 50 nm.
DNA Design
Summary
Seeking to come up with an innovative, new solution to the problem of anti-microbial resistance we have designed the UFO using the promising technology of DNA Origami. Central to our approach is the principle of modular design, we wanted to make a design which would be flexible and versatile to target and destroy different types of bacteria.
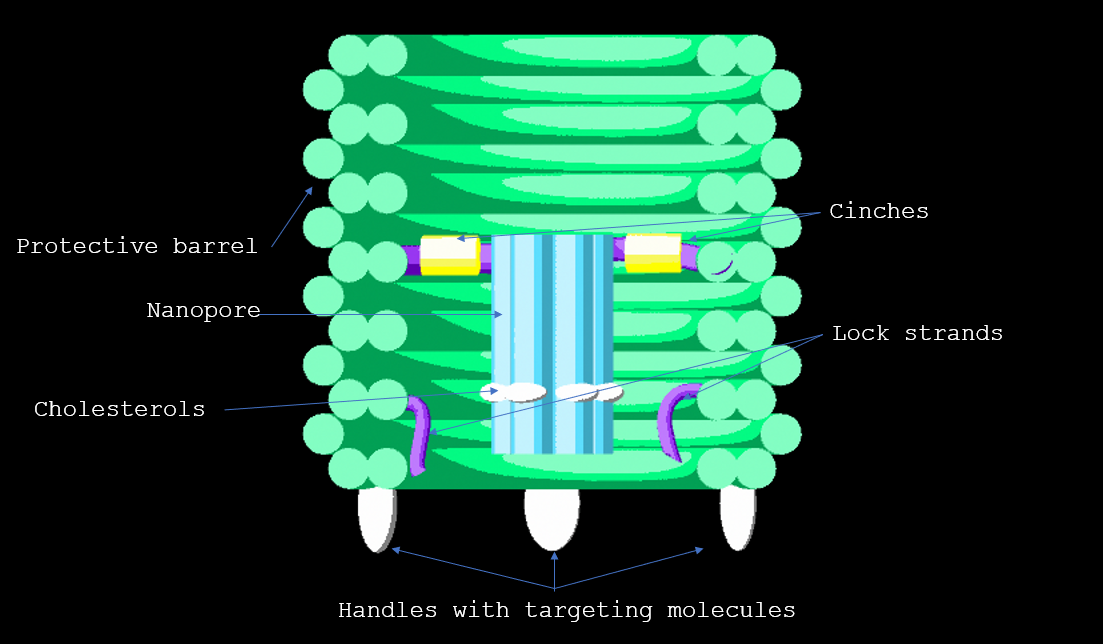
The device exists in 2 functional states: ‘Targeting’ and ‘Destruction’. In the targeting state the destruction device, which is a DNA nanopore, is prevented from being activated by enclosure in a protective barrel. Here it is held by a tether, a tiny single stranded DNA rope. Once the barrel has bound to its target, the DNA locks into position at the bottom of the barrel to penetrate the membrane. Punctures in the membrane will lead to disintegration of the cell, as inner contents flow out in a process known as lysis.
Design was primarily performed in caDNAno [1] using the p7308 scaffold, with additional tools such as NUPACK [2], Cando [3] and oxDNA [4] used for analysis.
A long strand (called the scaffold) is cinched by multiple smaller strands (called the staples). The staples contain strings of complementary bases to different scaffold parts, allowing different parts of the scaffold to be pulled together. This allows many geometries and designs to be created.
The device exists in 2 functional states: ‘Targeting’ and ‘Destruction’. In the targeting state the destruction device, which is a DNA nanopore, is prevented from being activated by enclosure in a protective barrel. Here it is held by a tether, a tiny single stranded DNA rope. Once the barrel has bound to its target, the DNA locks into position at the bottom of the barrel to penetrate the membrane. Punctures in the membrane will lead to disintegration of the cell, as inner contents flow out in a process known as lysis.
Design was primarily performed in caDNAno [1] using the p7308 scaffold, with additional tools such as NUPACK [2], Cando [3] and oxDNA [4] used for analysis.
Background
DNA is traditionally recognised as the self-replicating macromolecule found in living organisms, with the objective of determining what functions the cells perform. The development of DNA origami [1] refunctionalises these biochemicals as nanoscale building blocks for a wide range of structural applications. With a double helix radius of 1.2nm and the distance per nucleotide of 0.34nm DNA is an excellent choice for a building block on the nanoscale.
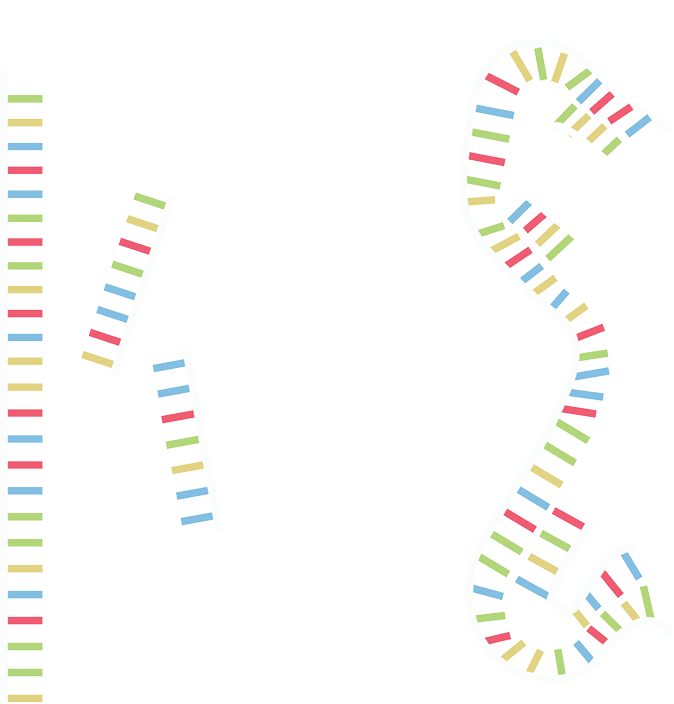
DNA origami is one of the most prevalent techniques used in DNA nanotechnology [1]. In DNA origami a long strand (called the scaffold) is cinched by multiple smaller strands (called the staples). The staples contain strings of complementary bases to different scaffold parts, allowing different parts of the scaffold to be pulled together (Figure 1.1). This allows many geometries and designs to be created.
Figure 1.1. We use staples to stick the scaffold together.
Double helices of DNA complete two full turns every 21 bases. This limits how frequently strands can “cross-over” between adjacent helices. We can hold adjacent helices together at these cross-over points by threading the DNA strands through both helices (Figure 1.2).
Figure 1.2. When connecting helices we are limited by geometry
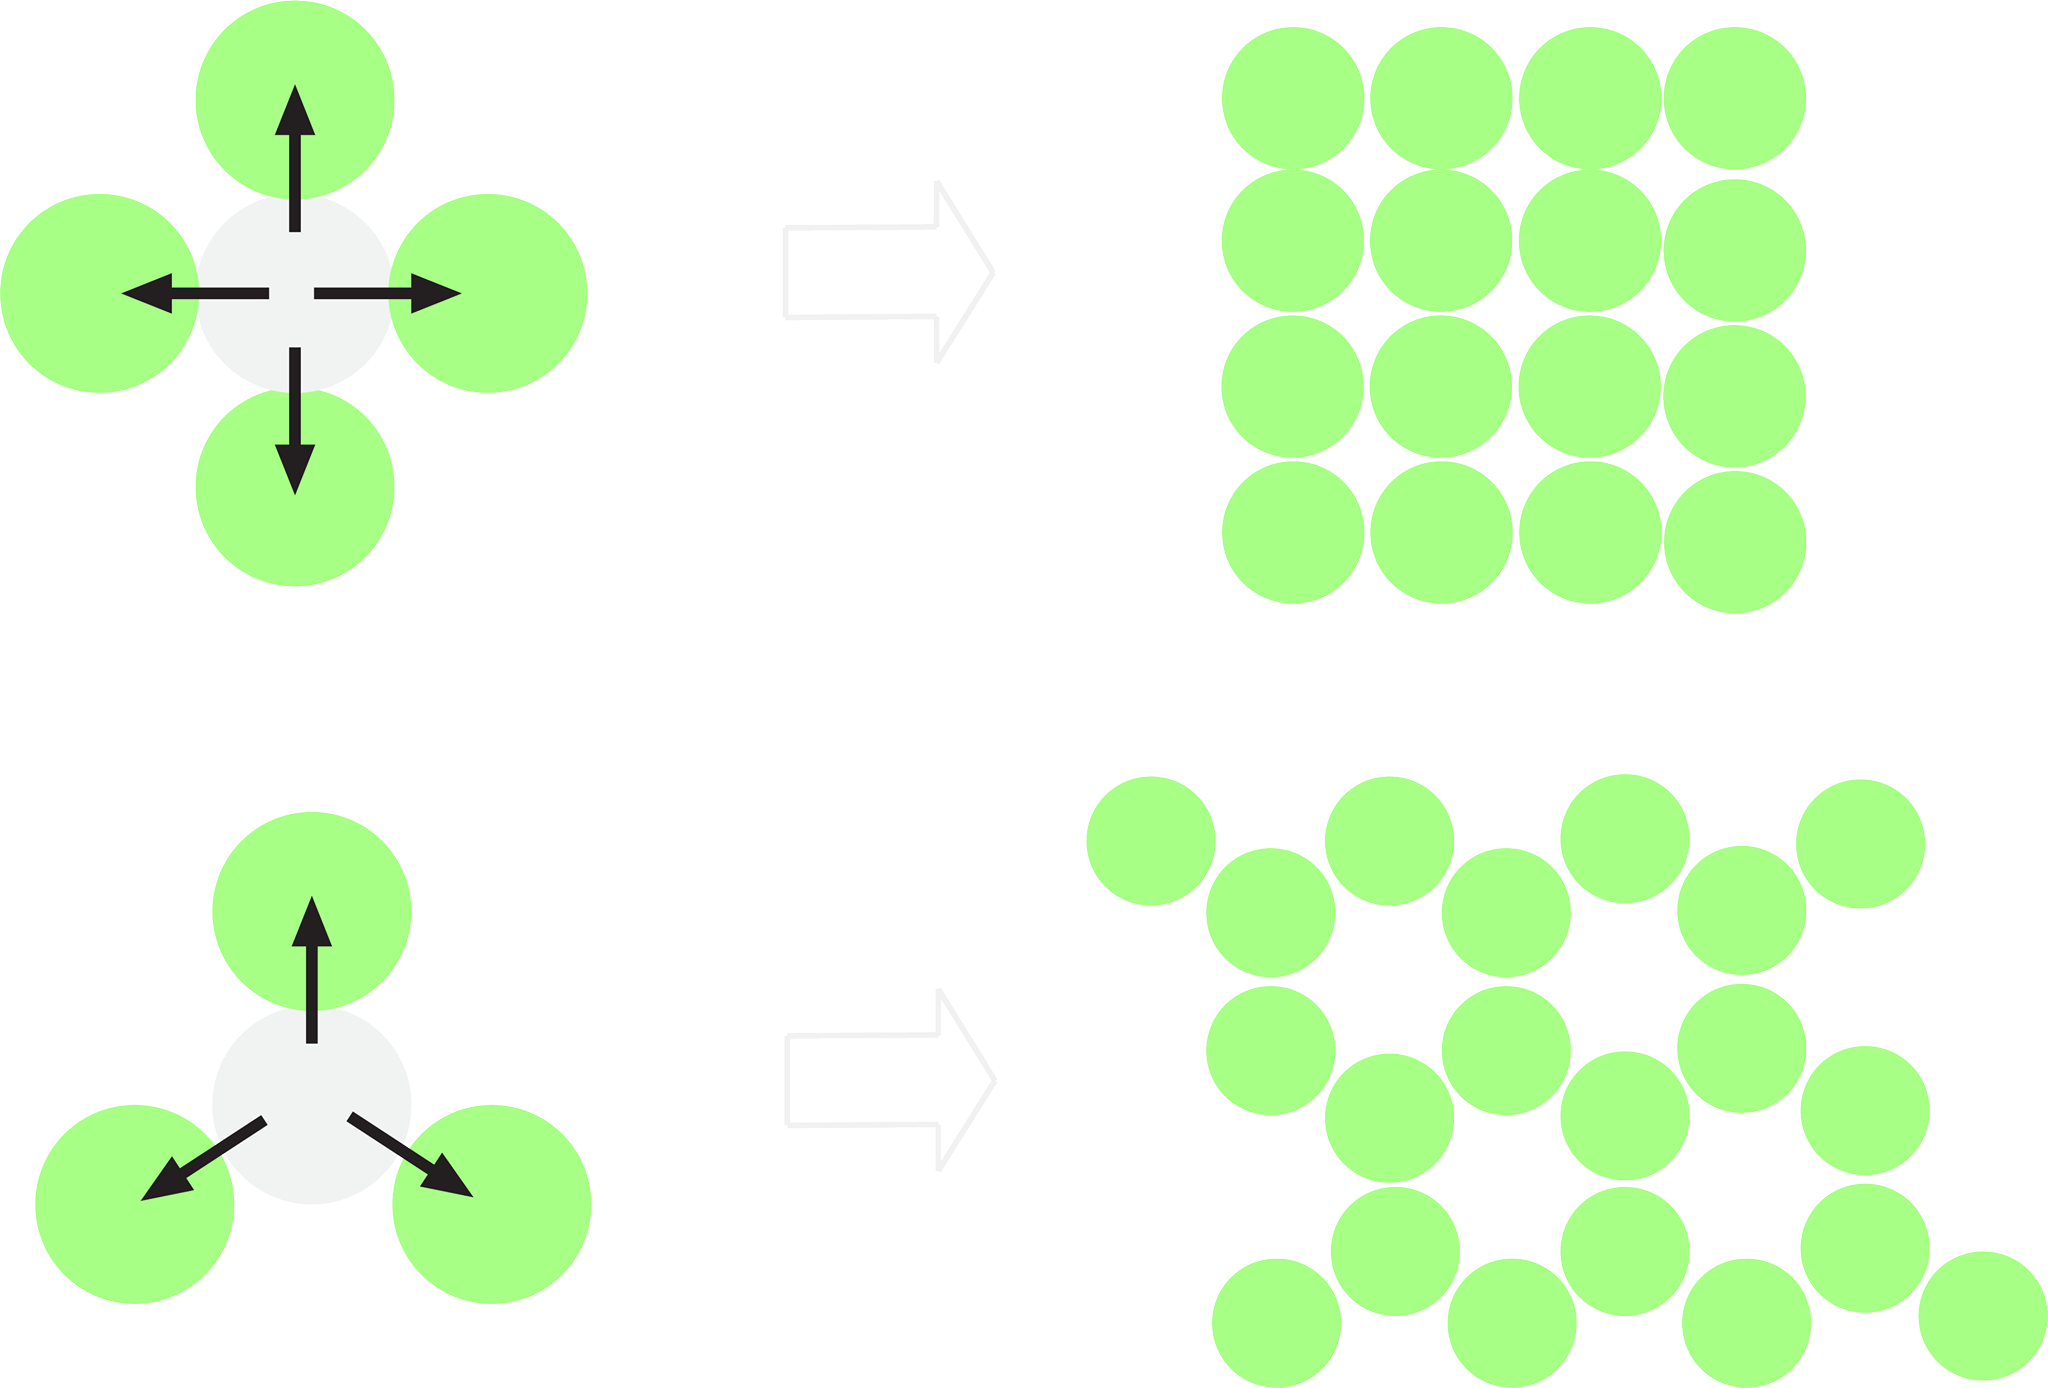
Cross-overs are the basis for structural stability of DNA nanostructures, and so must occur at regular intervals along all pairs of adjacent helices in the design. In order to create structures more complex than a few DNA helices, we need to choose a consistent framework to build with. There's no single right way to do this but some common frameworks for making structures are the square and hexagonal lattices (Figure 1.3).
Figure 1.3. Some ways we can arrange DNA helices when viewed from above
In a square lattice we can have cross-overs between helices every 21/4=5.25 base pairs, whereas hexagonal lattices can have cross-overs every 7 turns. This provides an advantage for the hexagonal lattice as we can have even spacing of our cross-overs.
An important concept in DNA origami is that of a toehold mediated strand displacement reaction. [3] Thermodynamics governs the behaviour of chemical reactions with systems favouring states that minimise total free energy. Complementary bases Hydrogen bond to each other, with longer strings of bases corresponding to lower free energy.
Figure 1.4. In equilbrium free energy is minimised
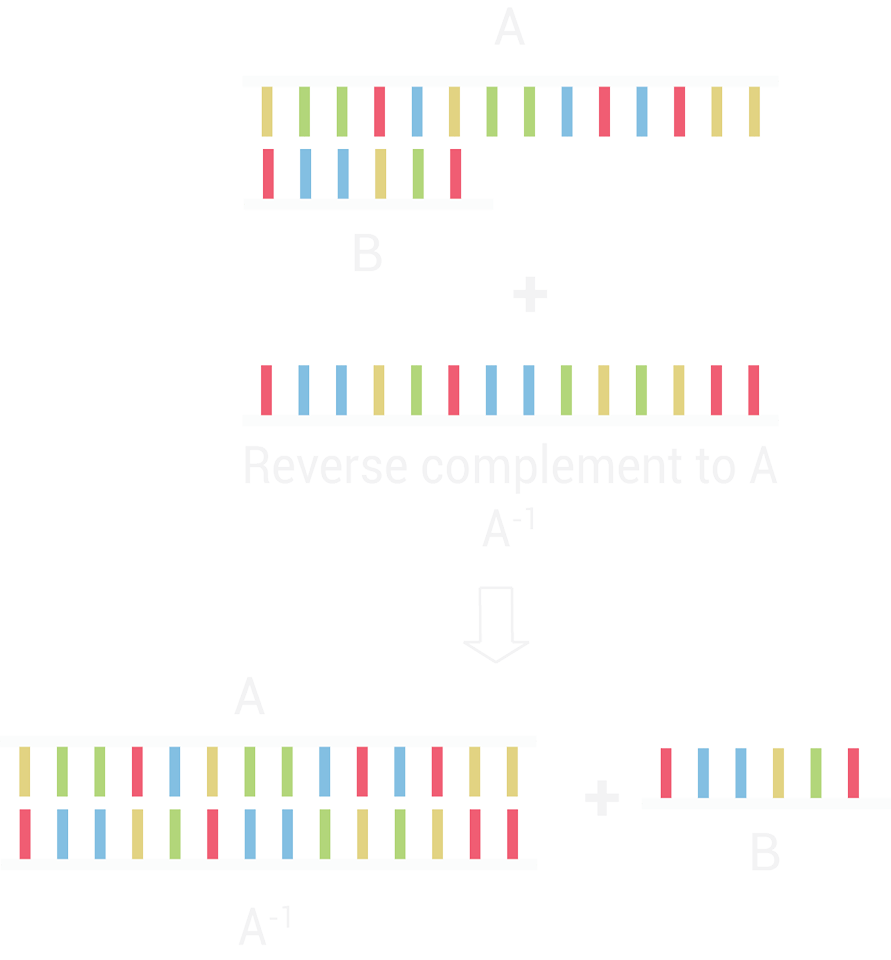
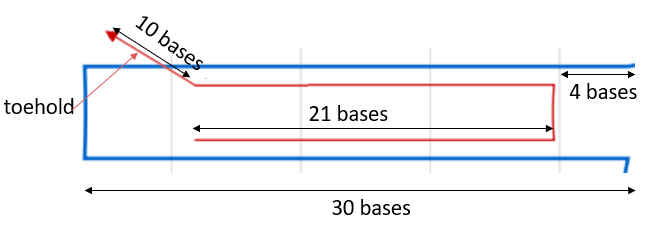
We can utilise this idea to our advantage. Consider two helices connected by a staple which has an additional 10 bases of unbonded single stranded DNA. This string of extra bases is called a “toehold” or “sticky end”. The reverse complement to the longer strand, when added can displace the shorter strand over time as thermal forces driven Brownian motion causes base Hydrogen bonds to break and form.
Figure 1.5. Strand displacement allows us to switch structures between different states
The basics here can be extended to form complex 3-dimensional shapes. Our project uses this advancement in a unique way to tackle the growing antimicrobial resistance problem in bacteria.
Targeting State - Closed Lock
Figure 1.6. The DNAlien when searching for it's target
Our destruction device, the nanopore, is not selective to different types of bacteria. This would leave us with a rogue lipid-membrane destroyer. In order to achieve selectivity we have enclosed the nanopore in a protective barrel. Previously, DNA nanostructures have been used to enclose therapeutic molecules such as cancer drugs, using shapes such as a 3D box [8], which can be triggered to open on reaching specific cellular targets [8*][8]. Given the close to cylindrical symmetry of the nanopore, a barrel seemed a suitable choice. .
The barrel we have chosen from the literature (DN2 from [9]) has height 30nm, outer diameter of 30nm and inner diameter of 18nm. The dimensions are suitable to enclose a nanopore of sufficient length to penetrate the membrane of gram-negative bacteria.
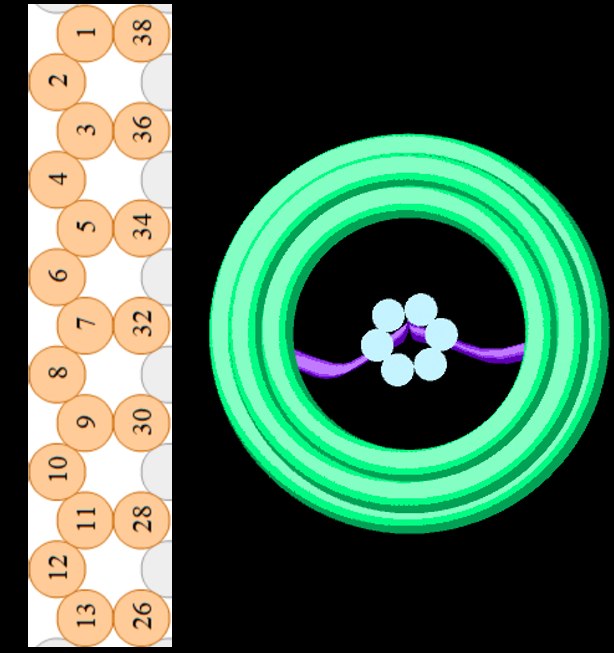
We modified the barrel scaffold by adding a single stranded DNA scaffold tether (named the tether) linking points on opposite sides of the barrel at the central inner-helix.
Figure 1.7. The DNAlien from above (right) and cross-section through one side of the barrel wall (left). A scaffold loop is added between opposite sides of Helix 32, shown in purple in the 3D model (right).
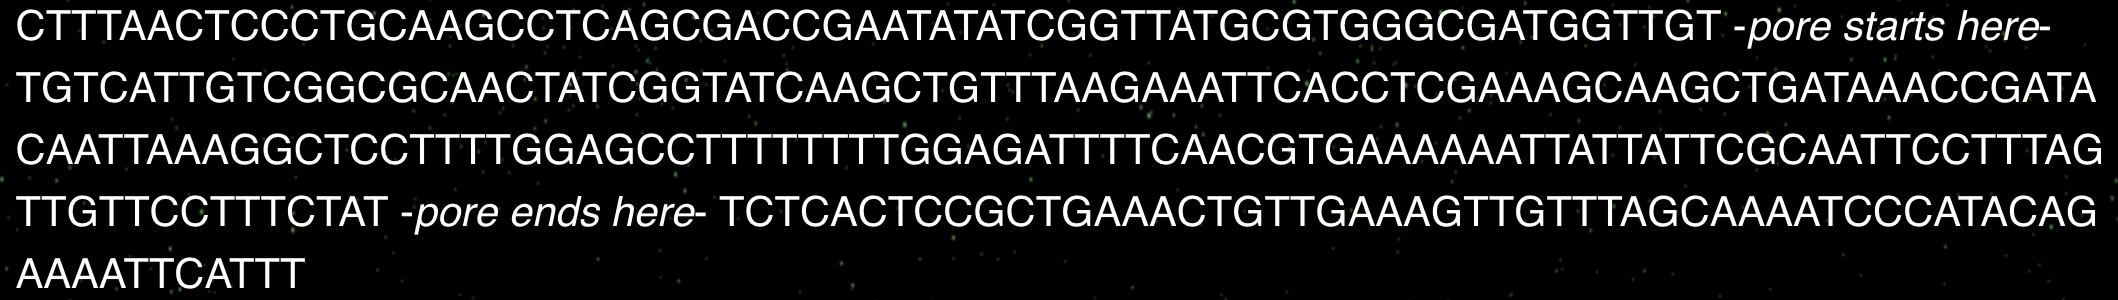
By choosing an appropriate scaffold starting point we could re-use most of the staples from the existing scaffold design. For the final design relevant part of the p7308 scaffold is:
The tether is a continuous strand of single stranded DNA and we use it as a scaffold for the pore. Single stranded DNA is flexible and hence we expect that the nanopore would move along as if fixed in the centre of a rope governed by Brownian motion due to the thermal energy of the environment. This works to our advantage once the DNAlien is attached to a lipid membrane, as it allows the pore to move to find the membrane. However while the barrel is moving through the environment seeking its target we want the pore to remain fixed inside the barrel.
To do this we used cinches, which were staples that hold the tether tighter. These cinches contain toeholds so by adding complementary strands we can release the cinches and allow the tether to extend.
Figure 1.7. Cinches (red) used in structure: By adding a complementary strand to the cinch the tether becomes free to extend
NUPACK was used to check cinches for secondary structures and verify the scaffold was correctly held together. Each cinch is 52 bases long, 21 for each part of the cable it pulls together and 10 bases for the toehold (shown in italics).
Figure 1.8. Cinches allow formation of stable equilibrium structures. Left shows cinch 1 and right shows cinch 2. In NUPack we added 1μM concentrations of the cinch strand, and one strand for each of the parts of the scaffold that we want to bring together. The result was 1μM of a complex containing all 3 initial strands
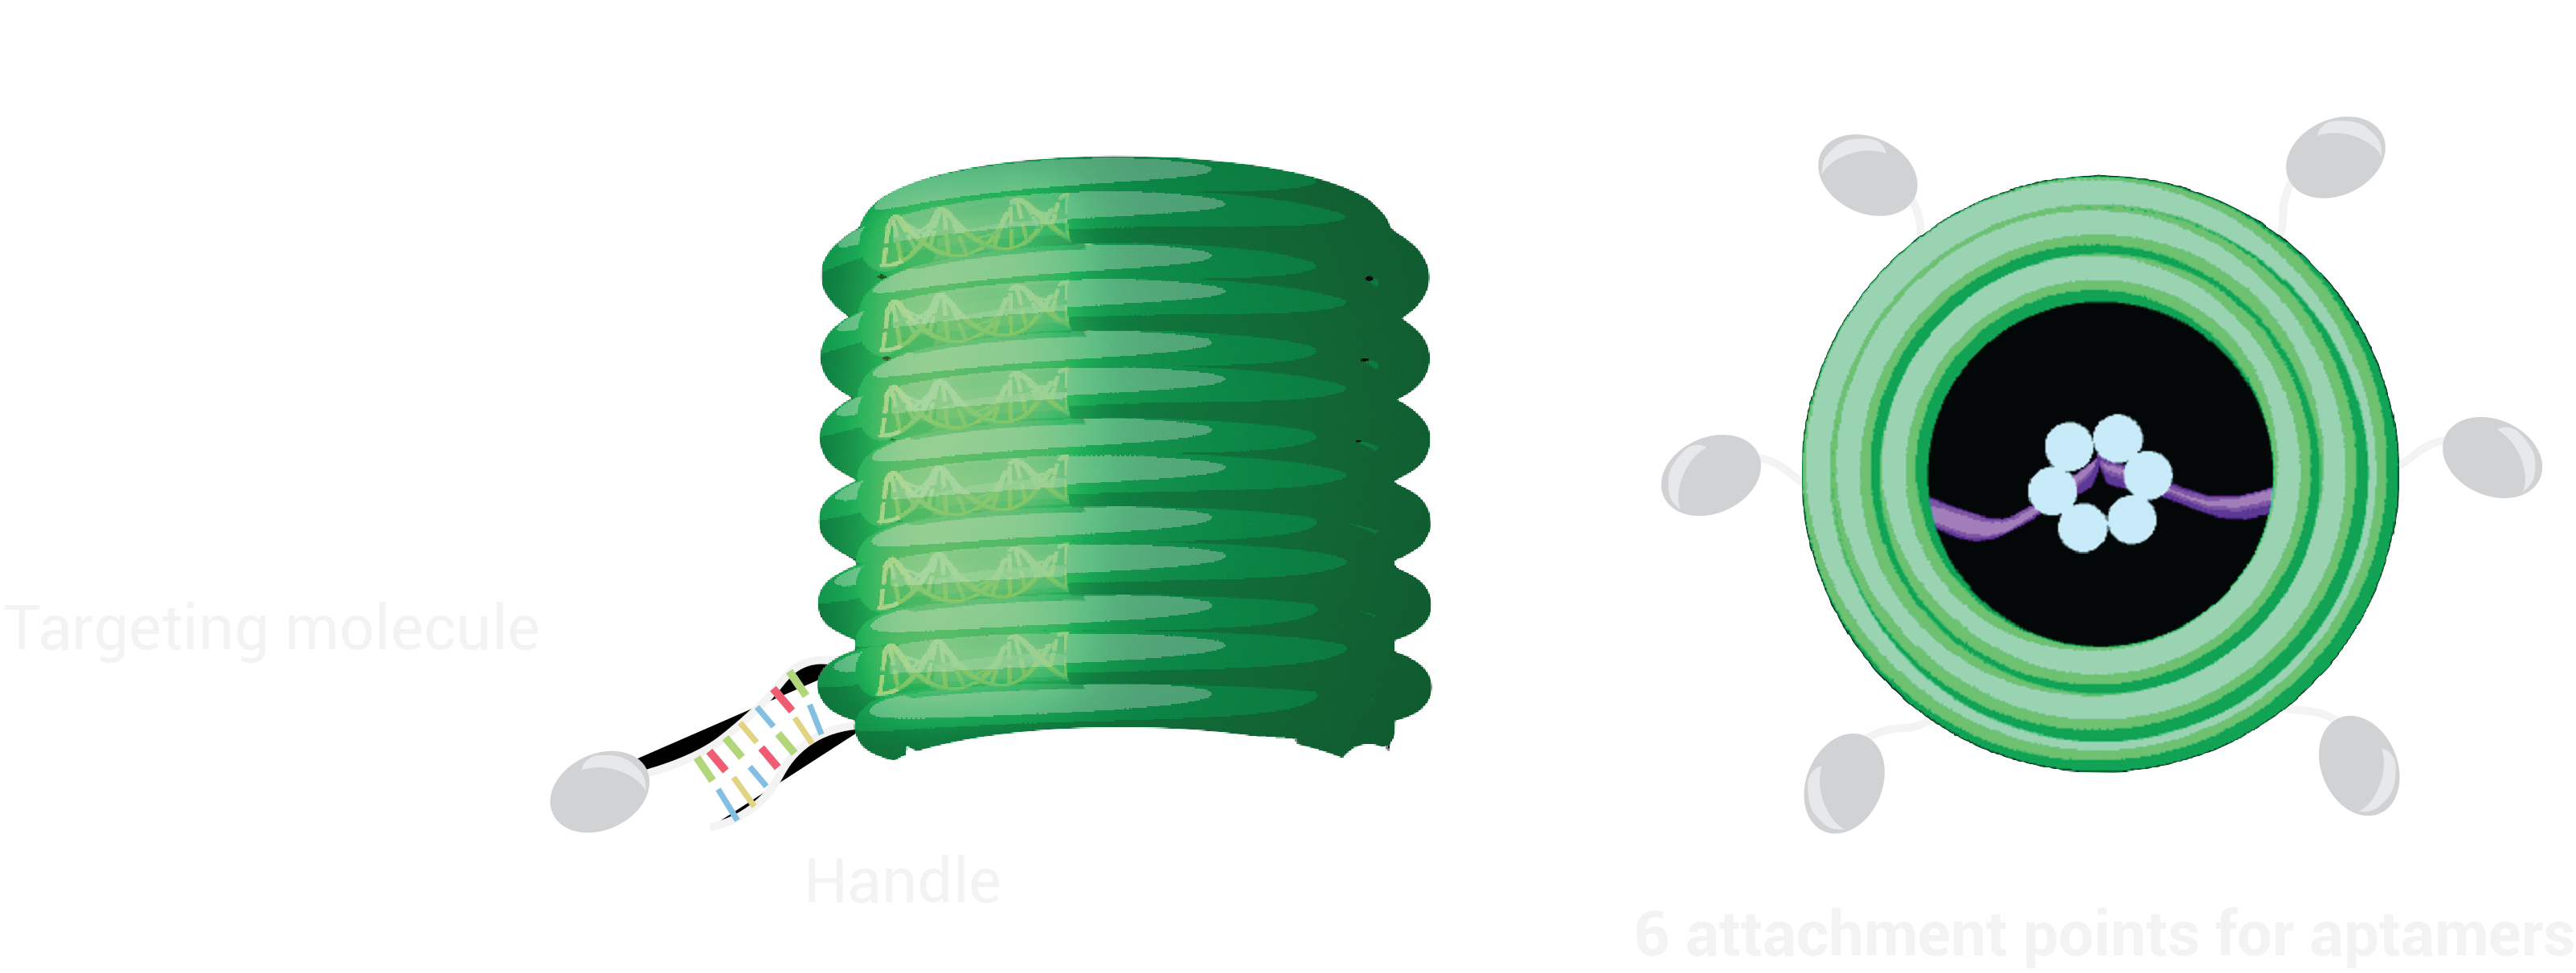
The challenge of targeting specific types of cells is a difficult one. It can be achieved in vivo for some cancers [9*] and can also be performed in vitro with bacteria, our specific focus [9**]. Aptamers are particular nucleic acid molecules that bind to specific targets, and can be used for this targeting. The secondary structure of an aptamer has a specific size, shape and charge that allows for the selective binding of its ligand. Ligand binding to the aptamer strand can outcompete hybridisation of the complementary DNA strand, which is displaced and then becomes available to drive structural switching of the nanostructure [8*].
For in vitro testing of the DNAlien we replace aptamers with cholesterols. Due to their hydrophilicity, cholesterols will embed lipid bilayers non-specifically, as opposed to the specific binding controlled by aptamers. By keeping the outside handles on the DNAlien the same and adding the appropriate cholesterol or aptamer to the corresponding anti-handle we envision targeting different bacteria.
In order to ensure ease of replaceability of targeting molecules, we use 21-base pair handles which are single stranded DNA sequences sticking off the barrel at 6 different points. These were added to the 5’ end of staples along helix 12, as cholesterol attachments can only be made on the 3’ end of the anti-handle (complement to handle) strand.
Figure 1.9. Attachment of aptamers or cholesterols to DNAlien is done using handles. Targeting molecule is added to the 3’ end of the complement to the handle.
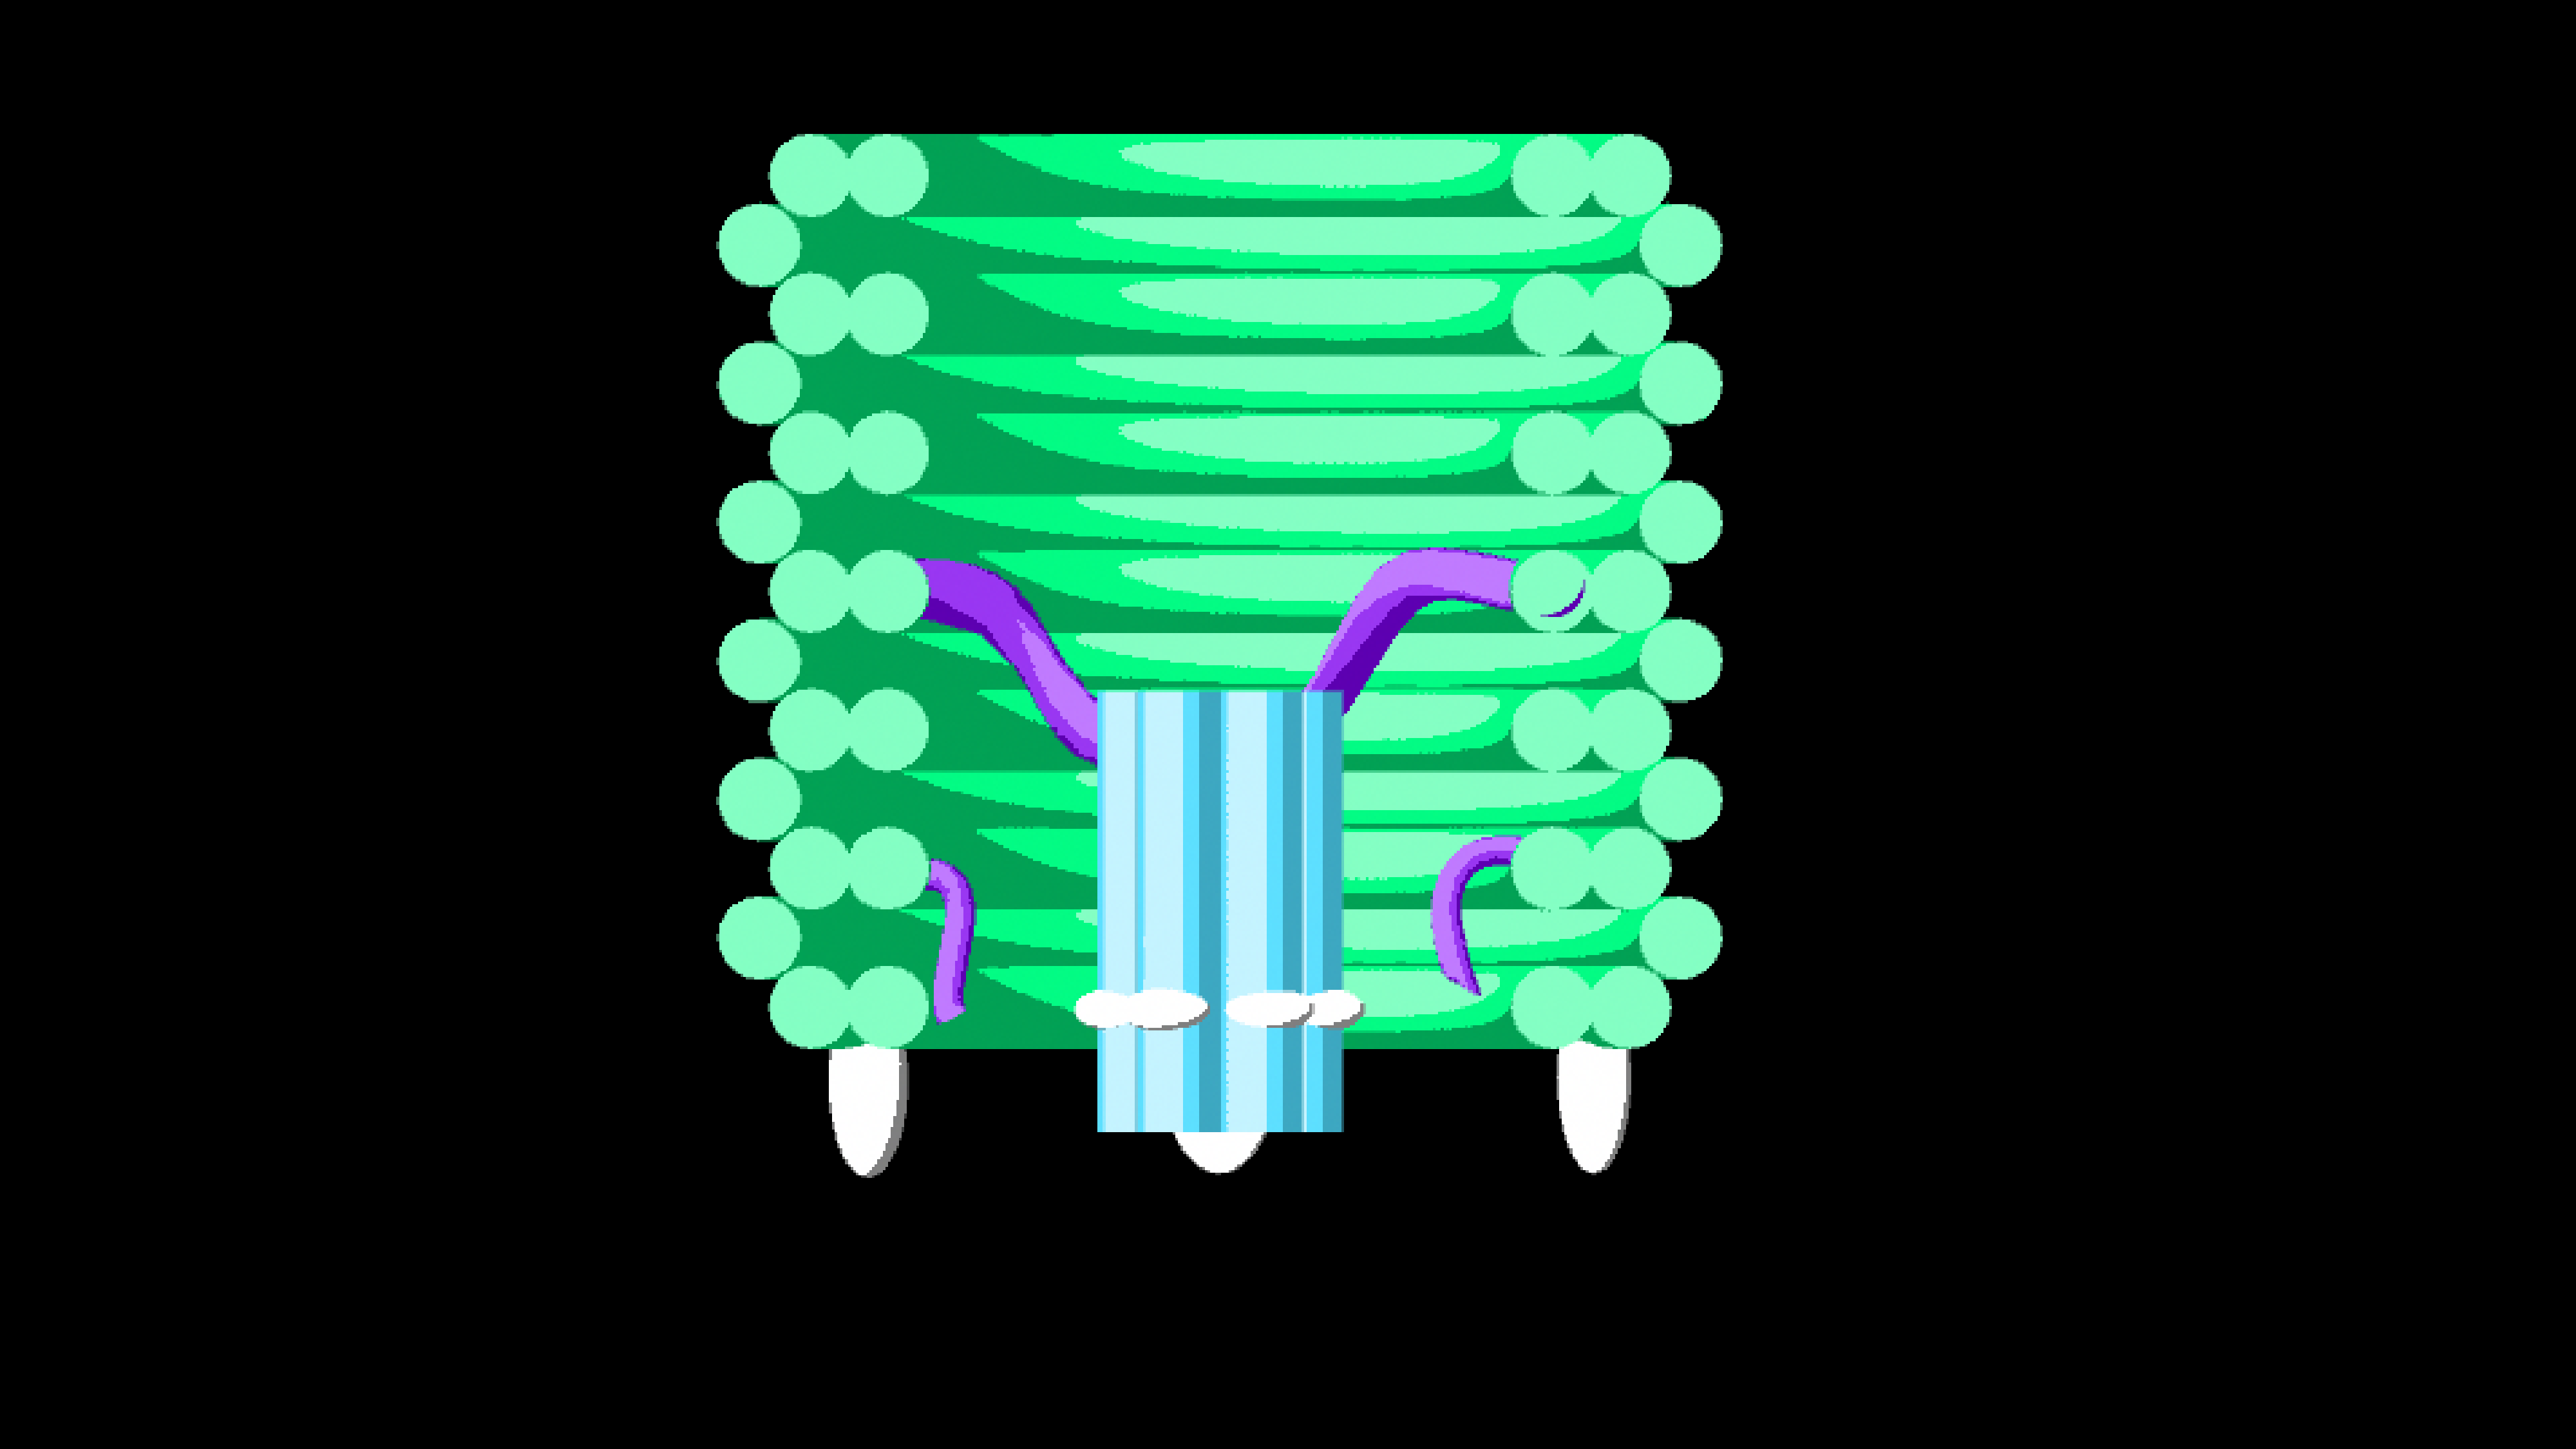
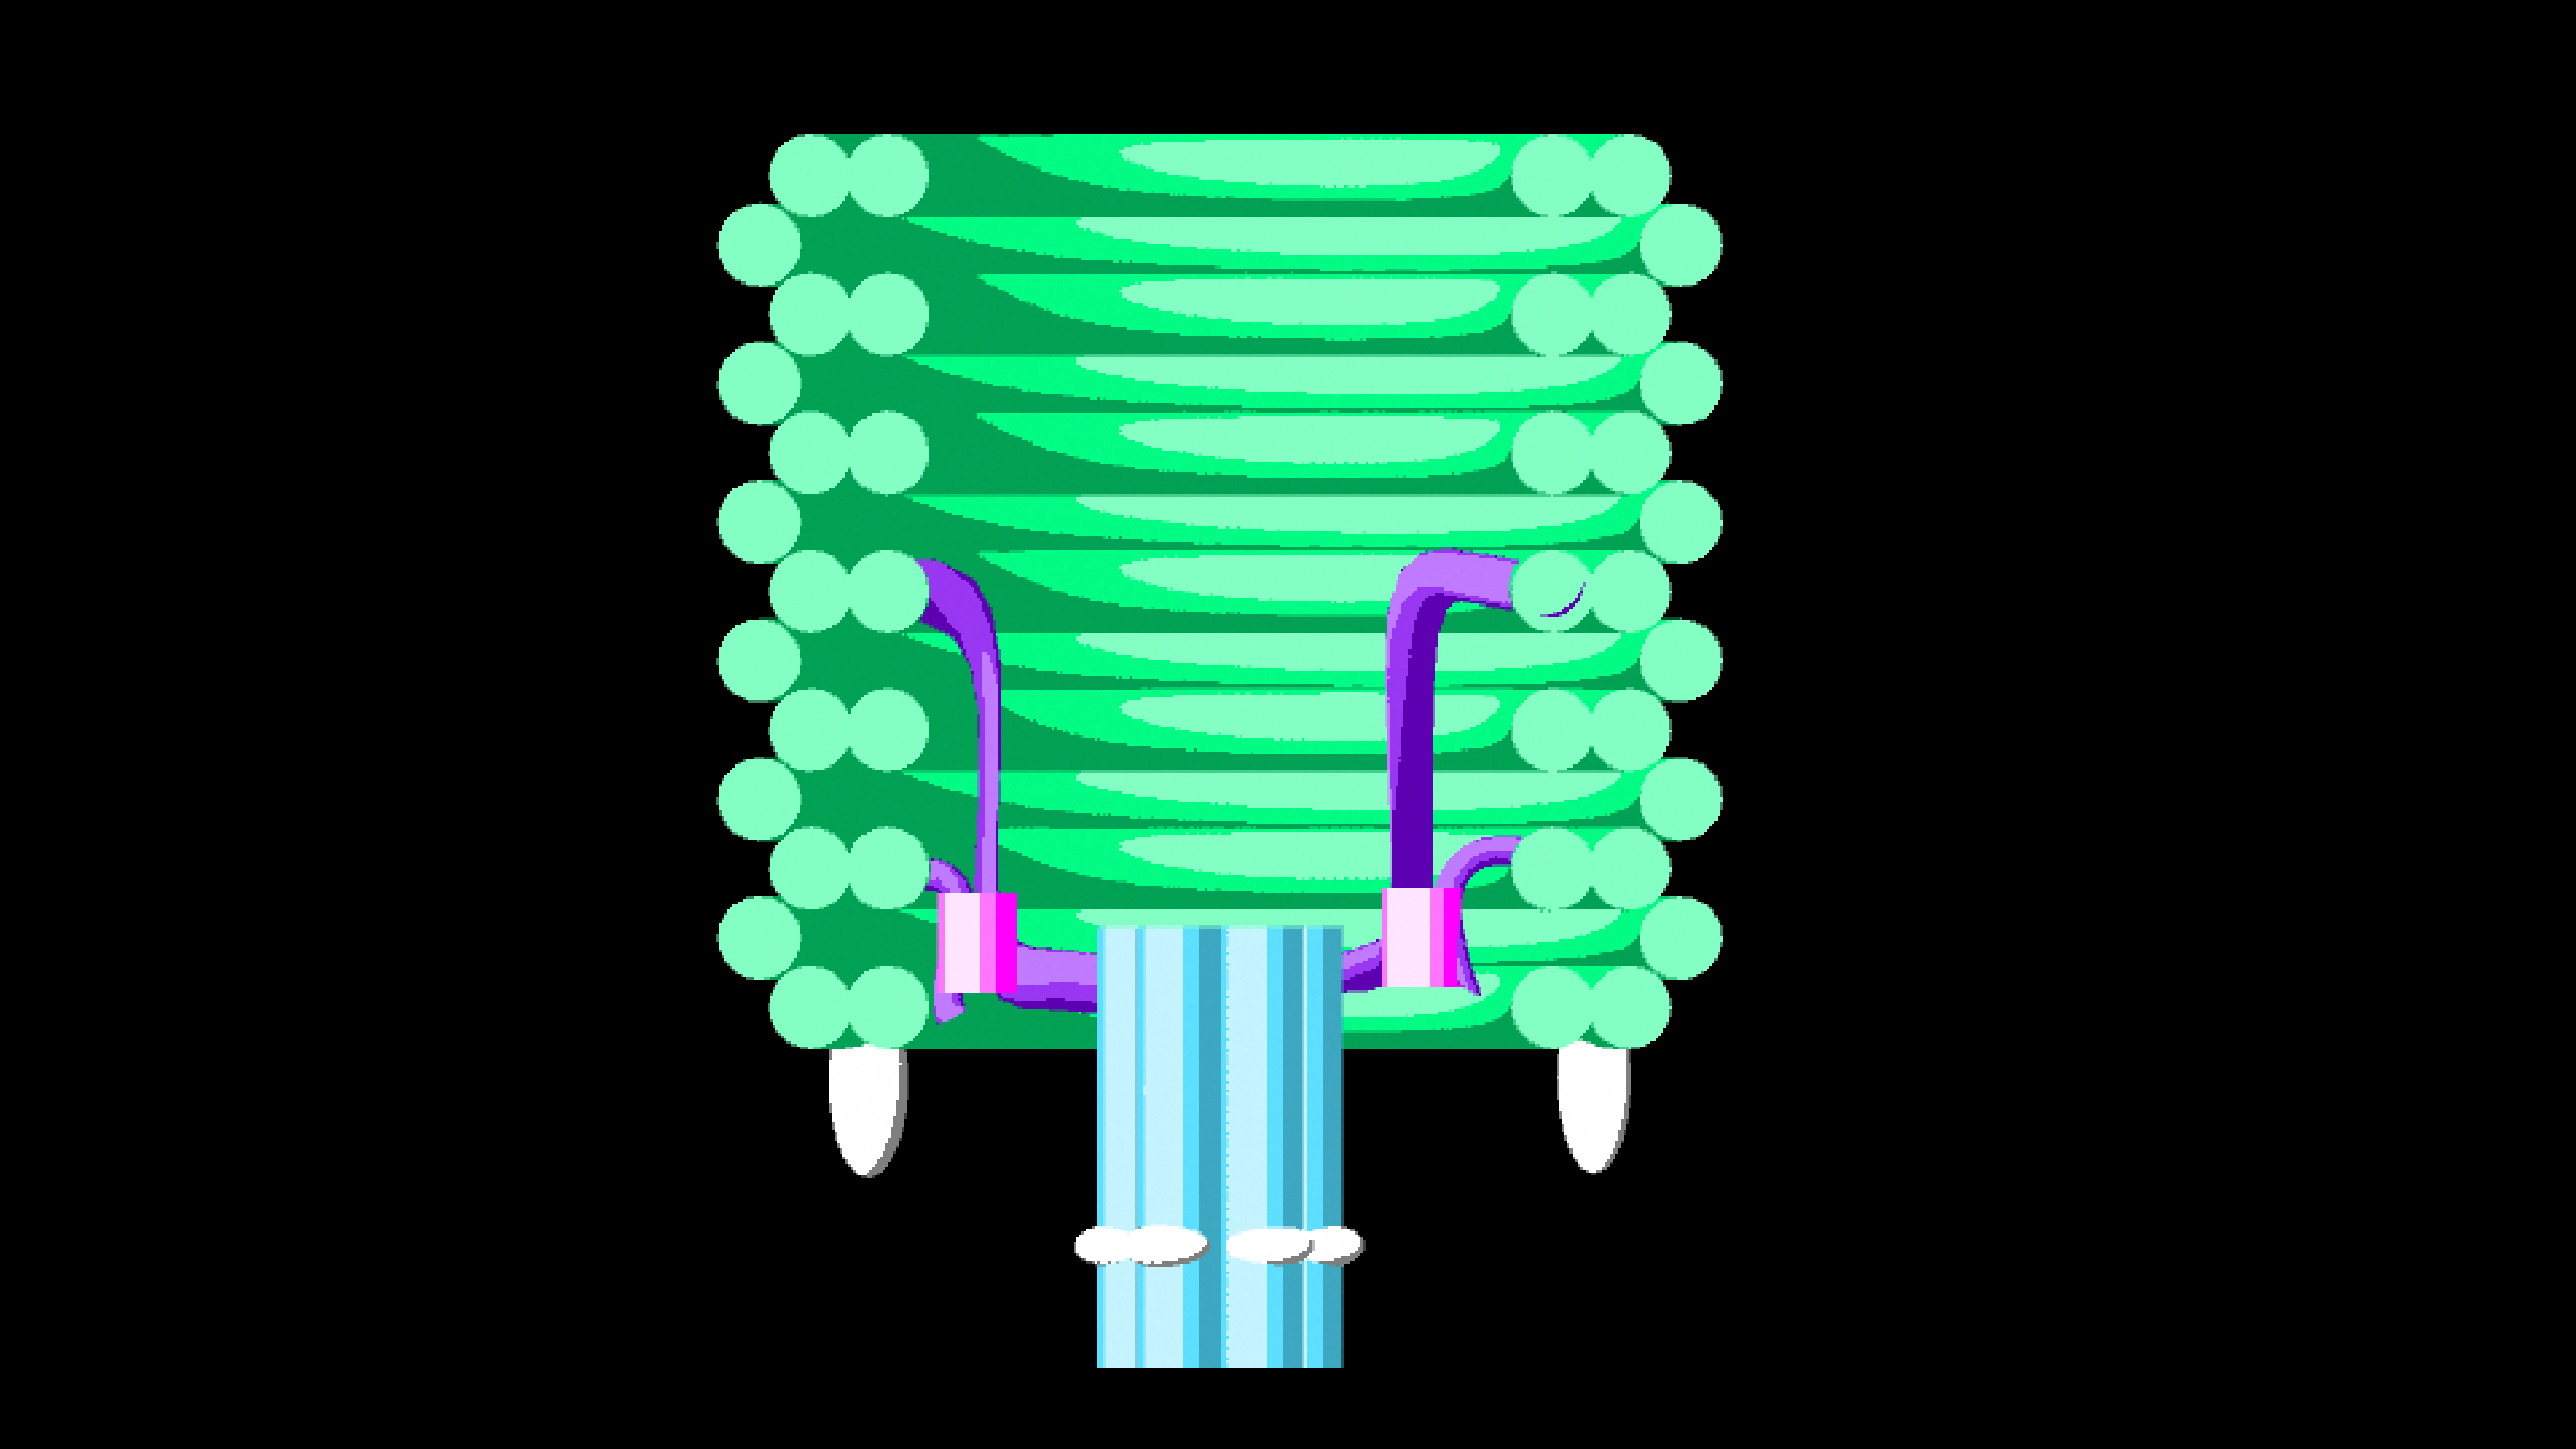
Figure 1.10.Adding complementary strands to the cinches unlock the pore.
Once the DNAlien has reached its target the time has come for the destruction mechanism to be released. Addition of complementary strands to cinches allow release and the pore which moves due to Brownian motion until it eventually reaches the membrane . We chose the tether length of 60 base pairs (~20 - 40 nm when unpaired) either side of the pore such that the tether would align with the bottom of the barrel allowing the pore to enter to the lipid membrane of the bacteria.
Targeting State - Closed Lock
Figure 1.12.Additional cinches used to lock pore in for destruction
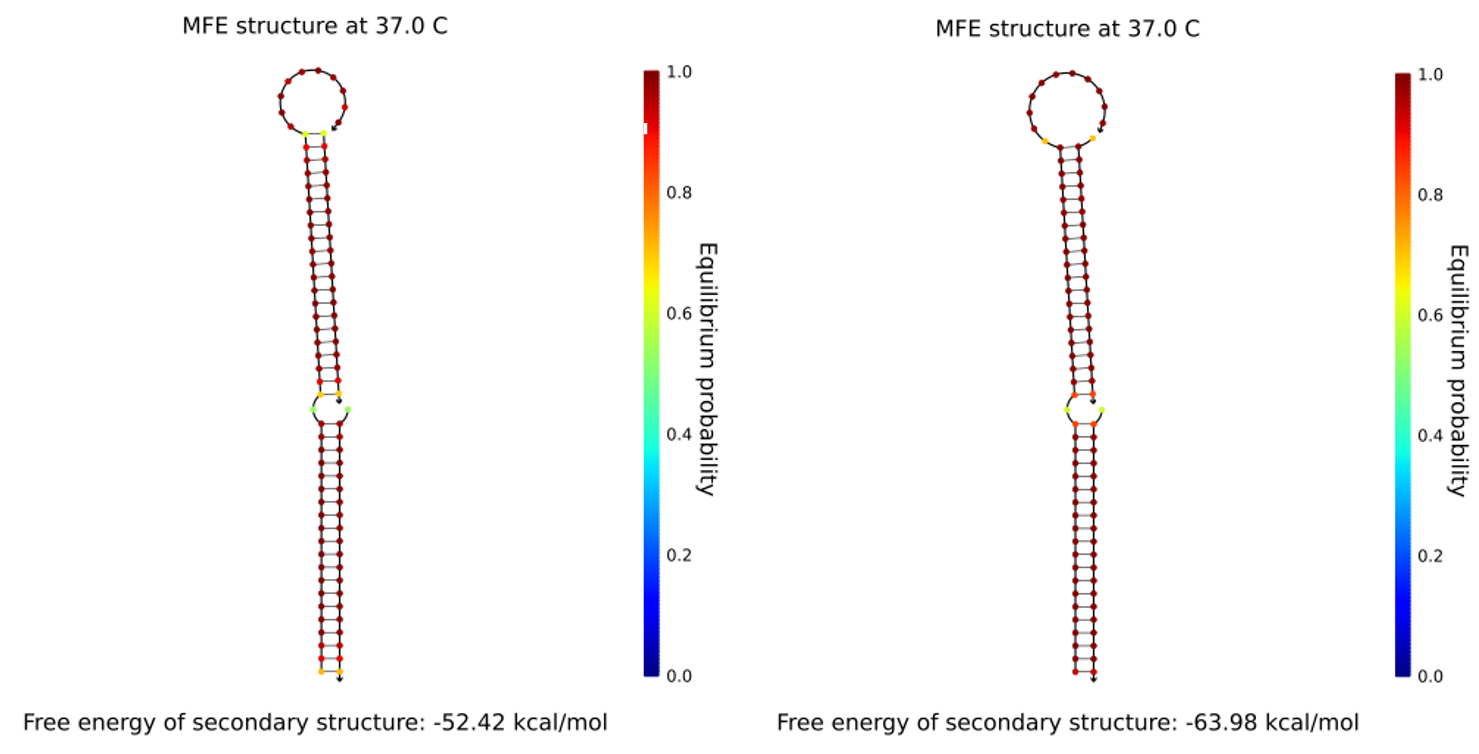
Having multiple short complementary sequences to different parts of the tether poses potential hybridisation issues. For our design to effectively take the lock-closed state then this must be thermodynamically favourable to lock-open state.
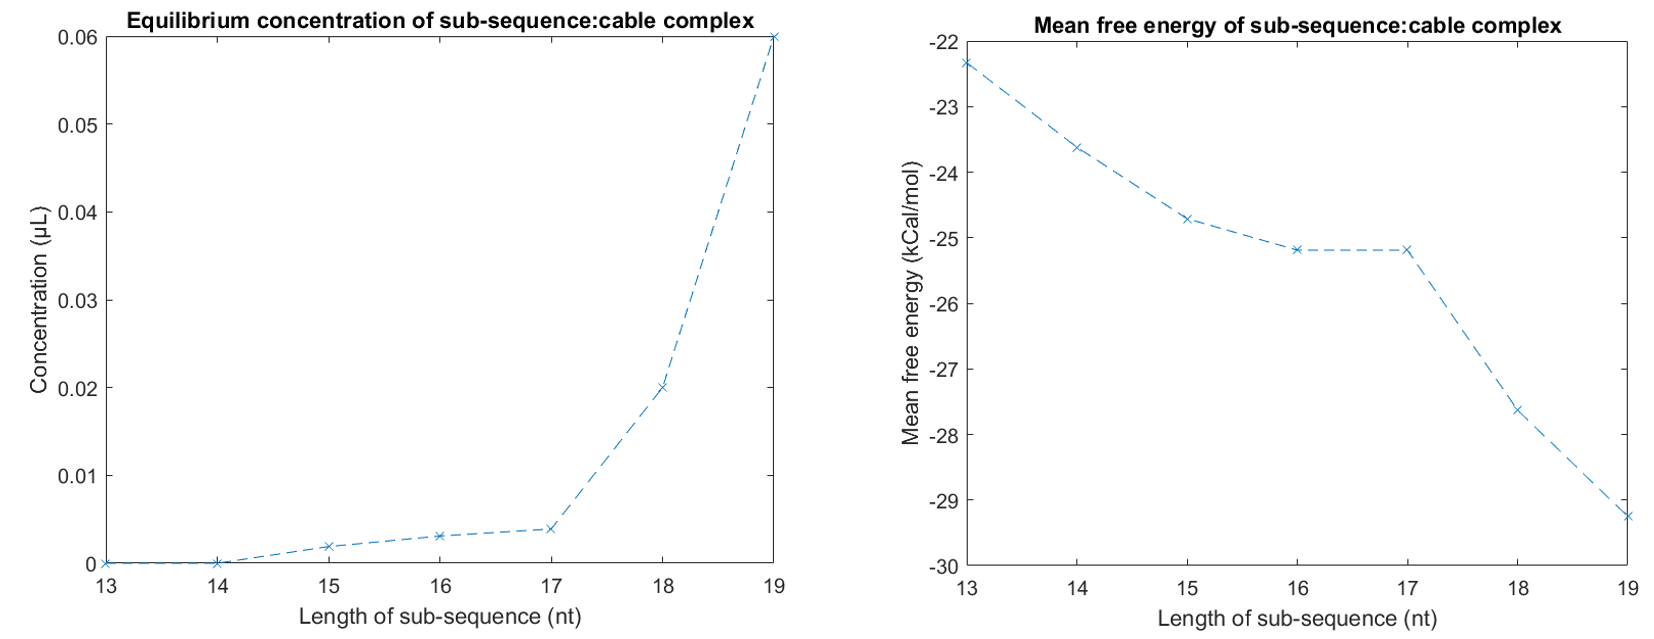
Initially the solution to this was ensuring that the cinch strands (which hold the pore in the closed state)were attached to the tether in segments of at least five bases longer than the sequence connecting the lock-open strands to the tether. We chose a length of 14 nucleotides hybridising the tether to the lock-closed strand as this allowed the system to remain stable in the closed state until the complementary strands to the cinches were added. To test this we considered the part of the scaffold to lock with two complementary strands (one of length 21), and varied length of secondary strength looking at mean free energy and equilibrium concentration of structures in NUPACK.
Figure 1.13.Determining an optimum length for fixed lock strands in NUPACK. 1μM tether sub-section (GAATATATCGGTTATGCGTGGGCGATGGTTGT) was added to solution with 1μM side of 21 nucleotide closed-lock cinch (CCATCGCCCACGCATAACCGA). We also added 1μM of the sub-section of cinch. Ideally cinch:tether complex (free energy of -32.83 kCal/mol) should have 1μM concentration in equilibrium corresponding to system fully in fixed lock state. 14 nt was found as optimum as for 13nt and 12nt the sub-sequence:tether complex equilibrium concentration began to dilute when removing full 21-nt cinch sequence.
We also tested an open locking using handles (for location see figure 12). In this configuration we would add additional cinches to hold the tether to the handles (see figure 14). Handles were chosen so that they were orthogonal to each other as well as outer handles to ensure that there were no unwanted cross-interactions.
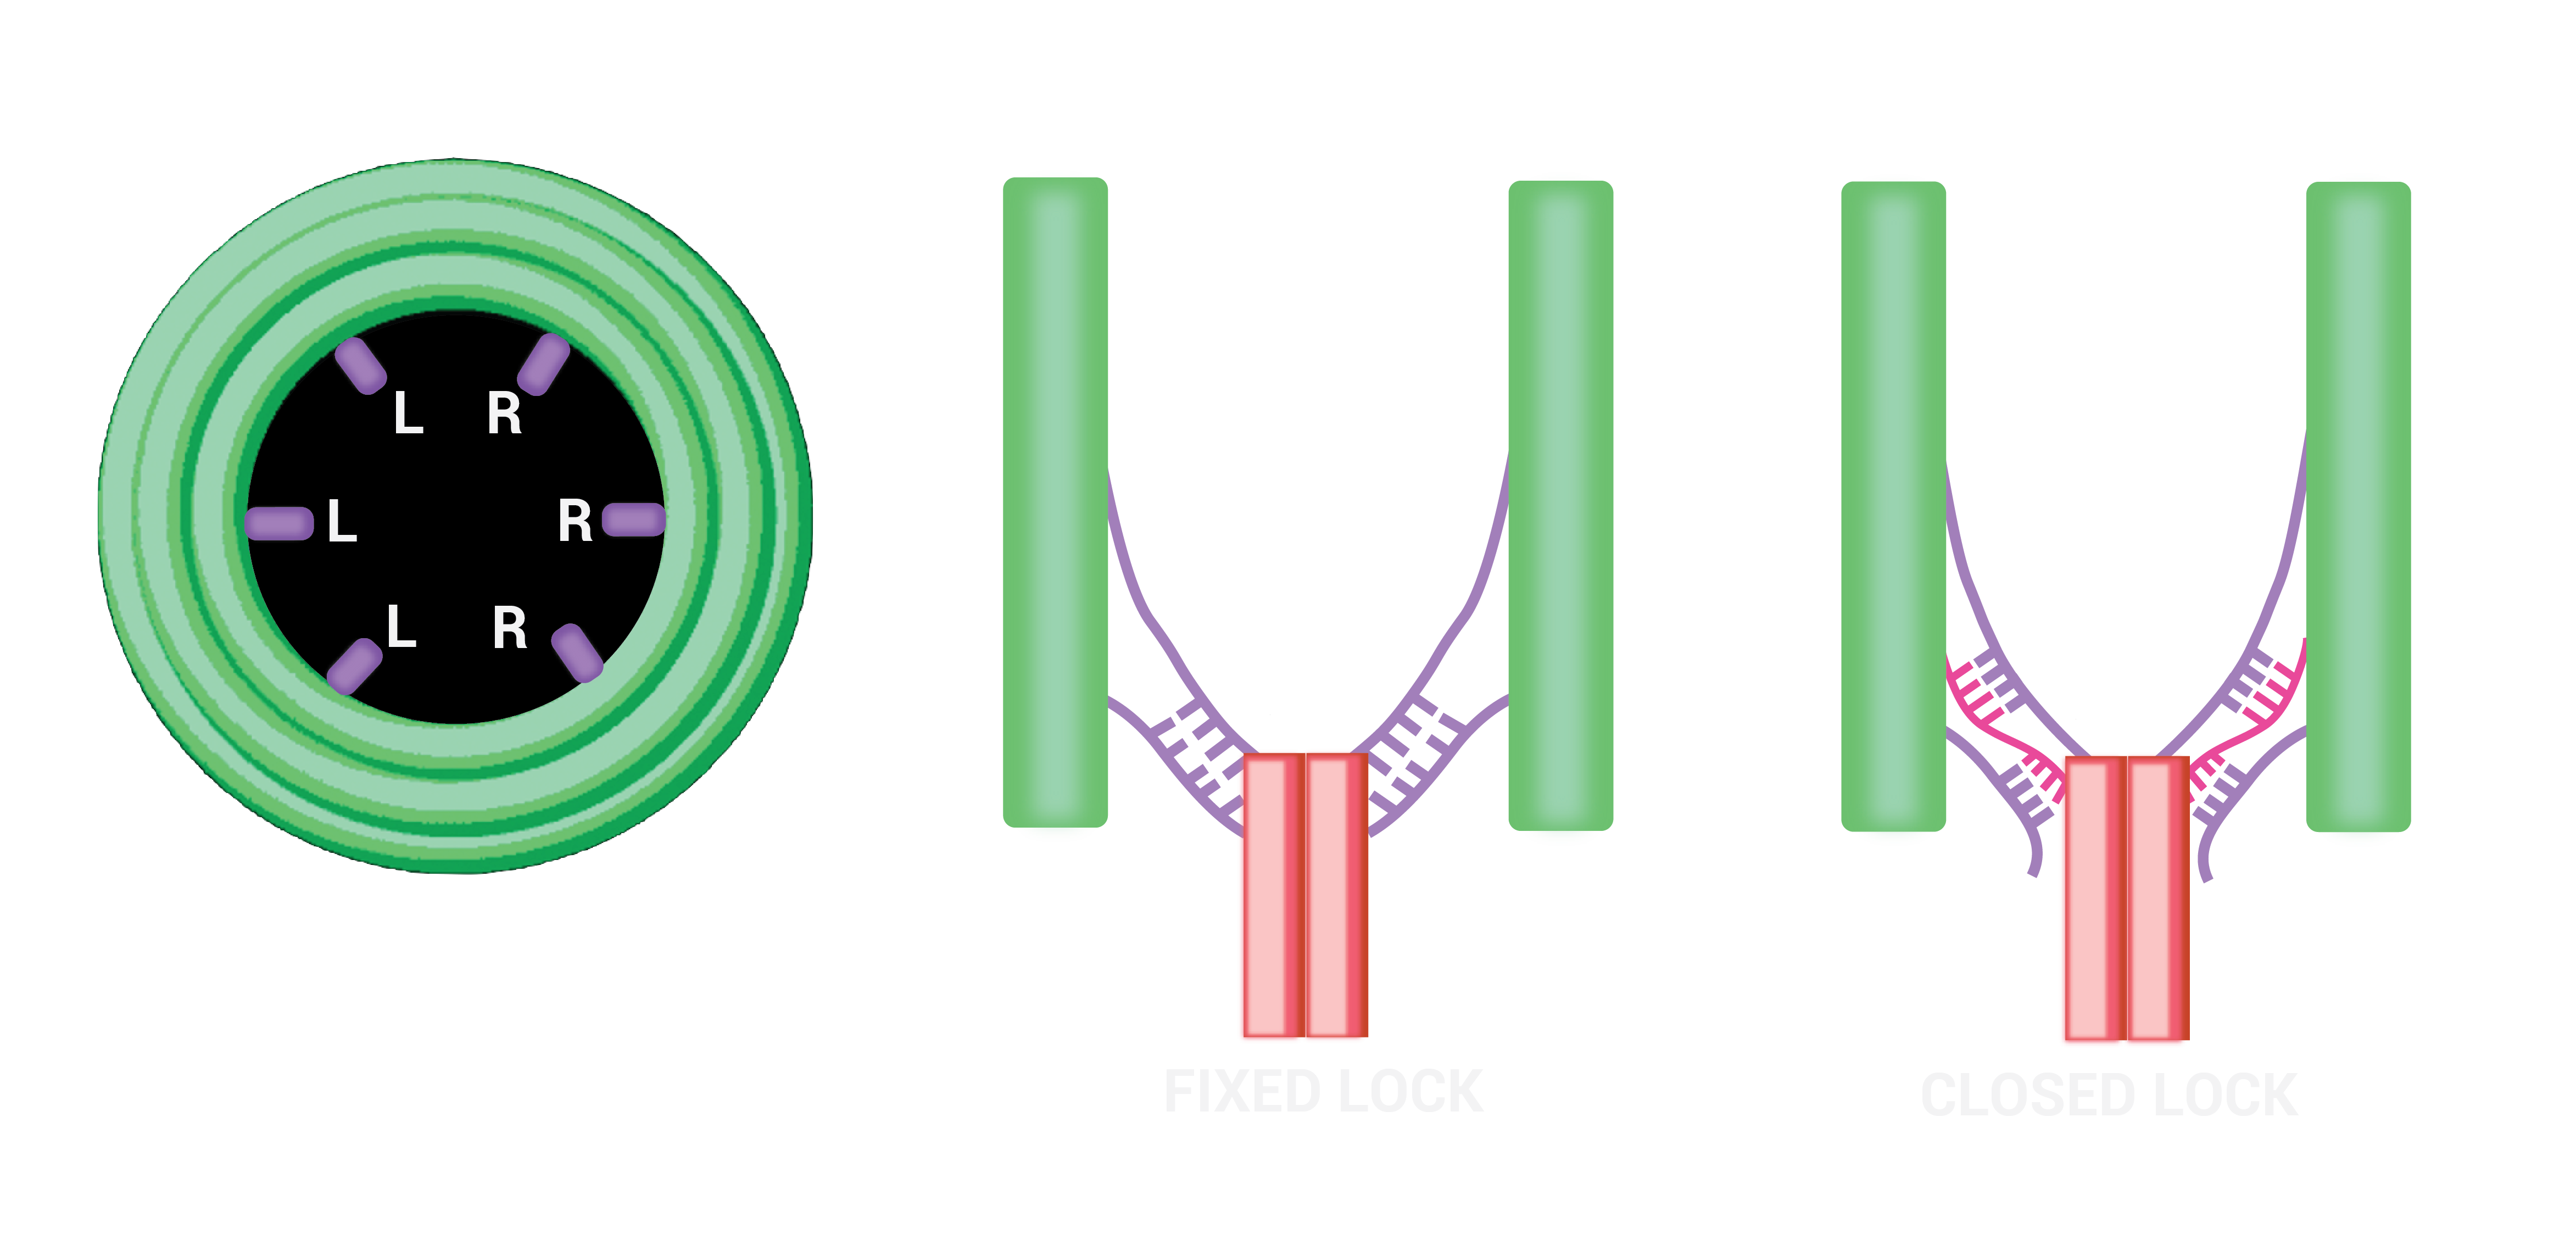
Figure 1.14.Comparison between locking mechanisms to destruction state. To increase probability of pore locking in this position we put 3 locking locations for each side of the tether. Either through directly holding the tether (fixed lock) or using an intermediate strand (open lock).
Both handles and fixed locking strands were added as extensions to the 3’ end of barrel staples. For the fixed-open locking strands between the 3’ end of barrel staples and 5’ end of complementary part a 5T spacer was used. Lengths were calculated to hold the pore at the bottom of barrel with degree of freedom to move 3nm vertically. Position distribution of the pore was analysed in oxDNA.
Destruction
Nanopores have been a significant focus for DNA nanotechnology over the past few years with uses varying from controlling transporting nutrients in and out of mammalian cells, as well as use as synthetic flippase enzymes[10-12]. They have potential as an effective new way of penetrating the outer membrane of gram-negative bacteria which makes them a solid basis for more complex destruction mechanisms. Perforation of the membrane from a DNAlien invasion will hopefully lead to lysis of bacteria.
After demonstrating experimentally that simple nanopores could insert into membranes and cause leakage of contents we needed to incorporate a pore into the DNAlien. We initially worked with Ohmann et. al’s 4 Helix Bundle (4HB) pore but then designed our own 6 Helix Bundle (6HB hereafter) pores, which we incorporated into the DNAlien.
Figure 1.15.Top view of a DNA origami nanopore. Probably replace with “hand drawn” style diagram.
We imposed the following design constraints on incorporating the pore in the barrel
The pore must be no longer than 15nm. We want the pore to be short enough such that it remains in the barrel when in the closed lock state.
In the closed lock state, the pore is symmetric relative to the cable. This means that the tether enters and exits the pore from opposite helices in the hexagonal pore.
Each helix must have multiple cross-overs to adjacent strands.
At least 4 cholesterols must be on the pore and all must be outward facing.
Cholesterols must be within 4 bases (1.34 nm) of each other along the pore to enable insertion into lipid bilayer.
Cholesterols must be positioned close to centre of the pore to ensure penetration through lipid bilayer, typical lipid bilayer thickness is ~2-3.5 nm
Each run of matched bases must be at least 7 base pairs long.
Strands used to form the nanopore must be at least 15 base pairs long and at most 52 base pairs.
The initial design (which we will refer to as nanoSHORT) was a 40 nucleotides long (13.3nm) nanopore with 4 cholesterols.
Figure 1.16. nanoSHORT pore design
While such a pore satisfies our design constraints. Under finite element analysis in Cando, the pore demonstrated instabilities.
This lead us to extend the pore to our final Nanopore design, which is referred to simply as 6HB. 6HB is 44 nucleotides long (14.7nm) and contains 5 cholesterols. The down side of such a design of the cholesterols no longer being at the same height along the pore. However as the lipid membrane is 2.5-3.5nm wide, separations of 2nm should not pose an issue.
Figure 1.17.Final 6HB pore design
Cando analysis of this pore display greater stability. Molecular dynamics and Monte Carlo simulations of this pore in oxDNA have given further insight into the structural properties of the pore.
OxDNA
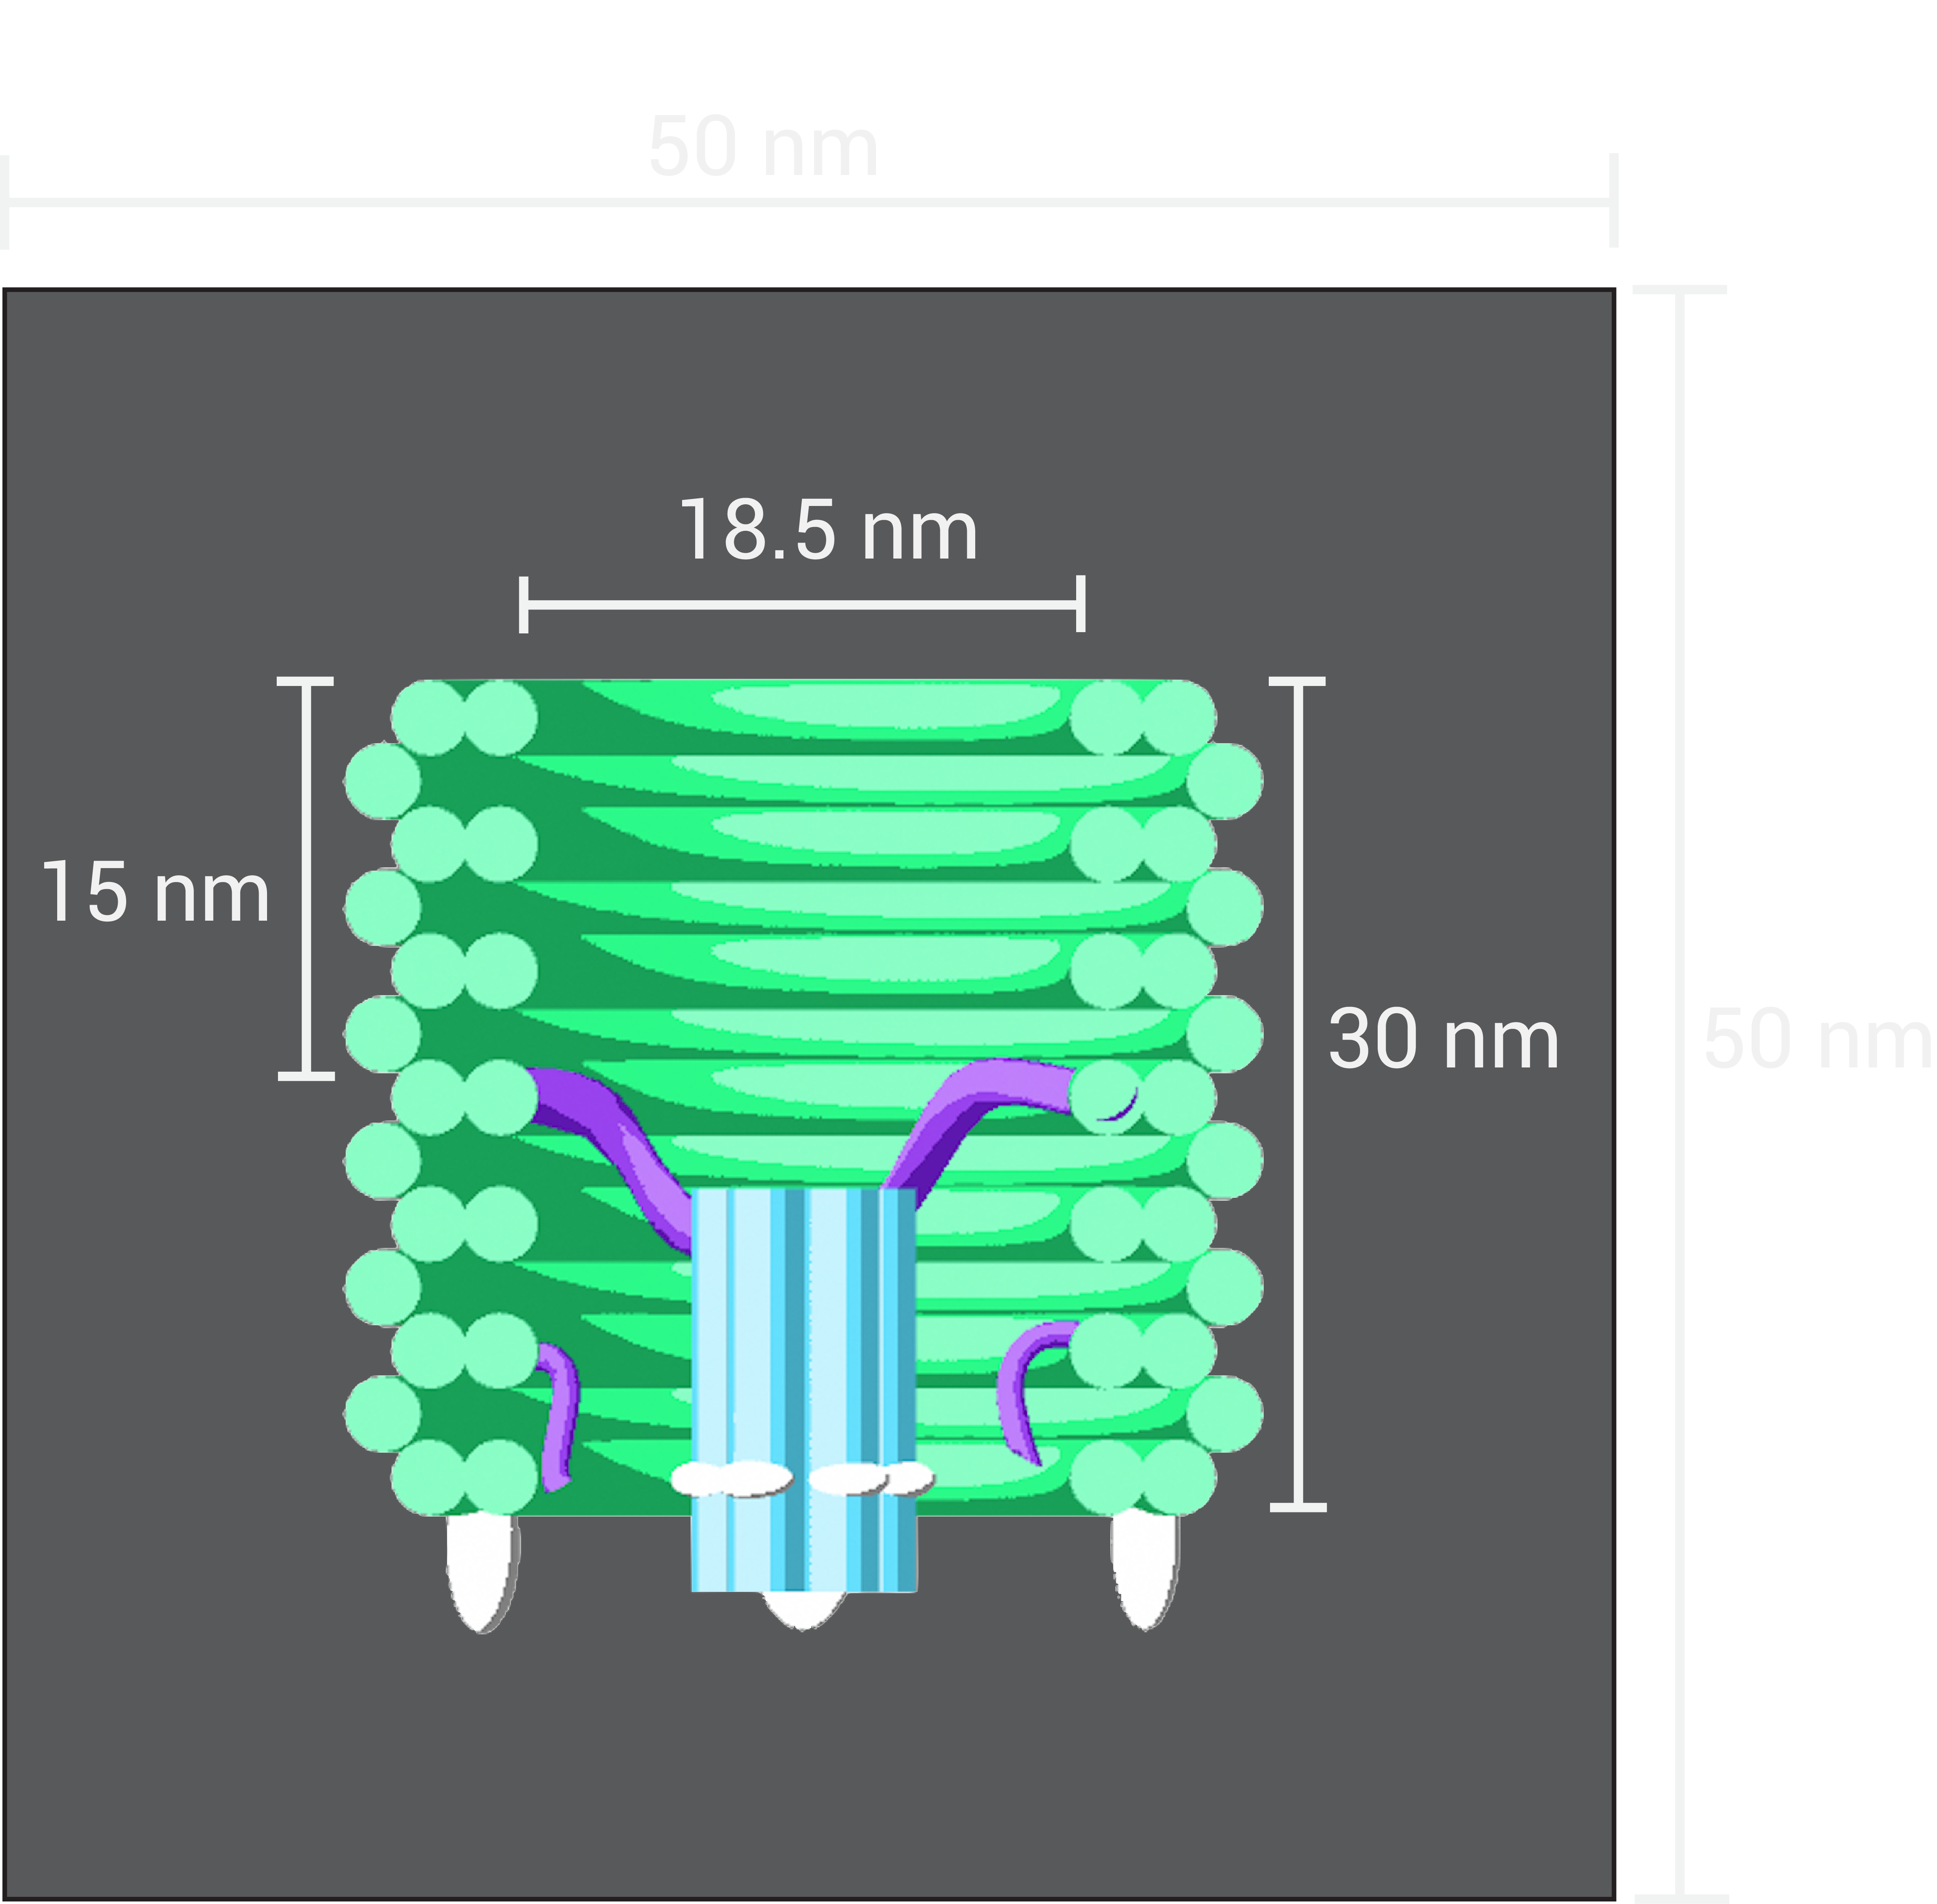
In parallel with experiments, Brownian Dynamics simulations were performed using a coarse grained DNA model in the oxDNA software package [4][3]. Molecular simulations provide an insight into nanoscale interactions, however they are very computationally intensive and hence, are usually not an effective way to describe a system on time-scales much longer than milliseconds. We considered the DNAlien system as a nanopore (the 6 Helix Bundle, described below) attached to a single stranded DNA tether which has both ends fixed 18.5nm apart. To simulate the walls of the barrel 4 force planes are used (arranged in rectangular box, of side length equal 18.5nm) which apply forces on the nucleotides which exit the box.
Figure 1.18. The set-up of the simulation oxDNA. Total size of the box is 50nm to ensure all DNA remains in the box.
Molecular dynamics simulations were run at a temperature of 30°C for a period of time corresponding to 0.03ms with positions of particles being saved every 33ns. The tethered pore moves freely through the barrel due to Brownian motion.
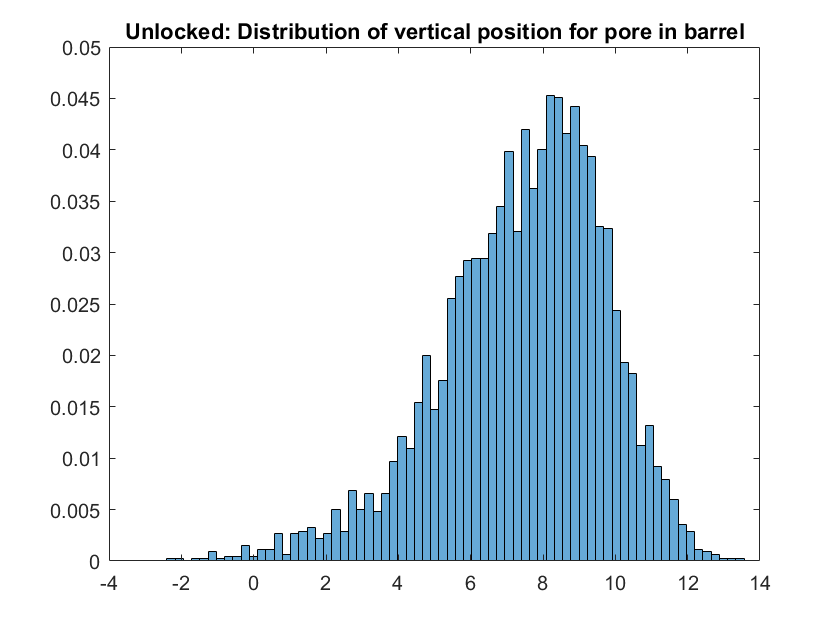
The position of a nucleotide halfway along the pore (at a point of cholesterol attachment) was tracked. Here, we consider the vertical position of the pore in the barrel. A displacement of 15nm from the centre of the barrel corresponds to the pores cholesterols being found outside the barrel.
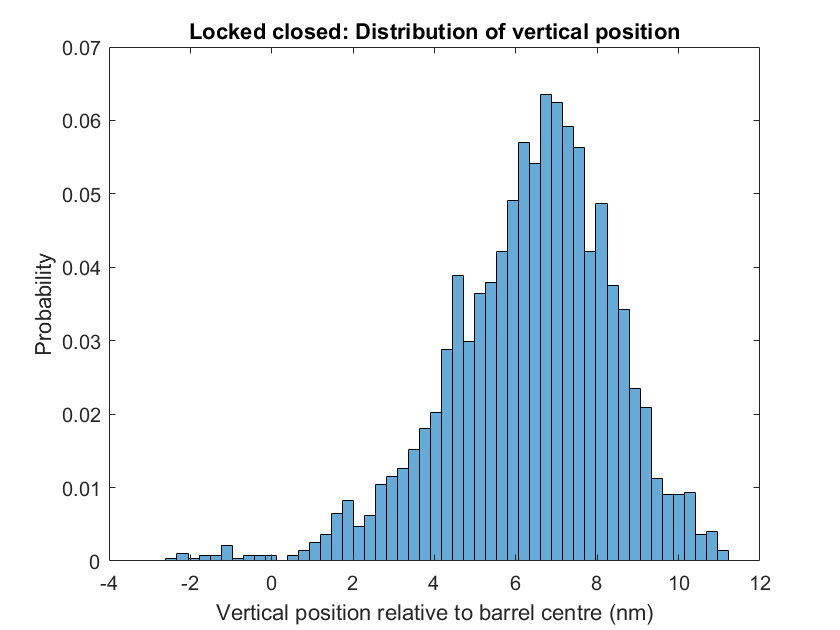
Figure 1.19. Distribution of the height of the pore’s cholesterols in the barrel relative to the centre of the barrel.
We found that for our design, for sampled time we found that over 99% of the time more than half of the pore remains in the barrel. This result demonstrates the necessity of the locking strands for helping insertion of the nanopore into the membrane. In addition, for future designs increasing the tether length by around 10 nucleotides is appropriate to ensure smooth transitions between states.
For the closed lock state cinches hold the pore inside the barrel (with sequences specified above). Motion of the pore in this state is restricted as planneds so that the cholesterols remain at least 3.5nm from the end of the barrel, meaning the nanopore will not be able to penetrate any bacteria in this position.
Figure 1.20. The cholesterol remains away from edge of barrel upon addition of cinches.
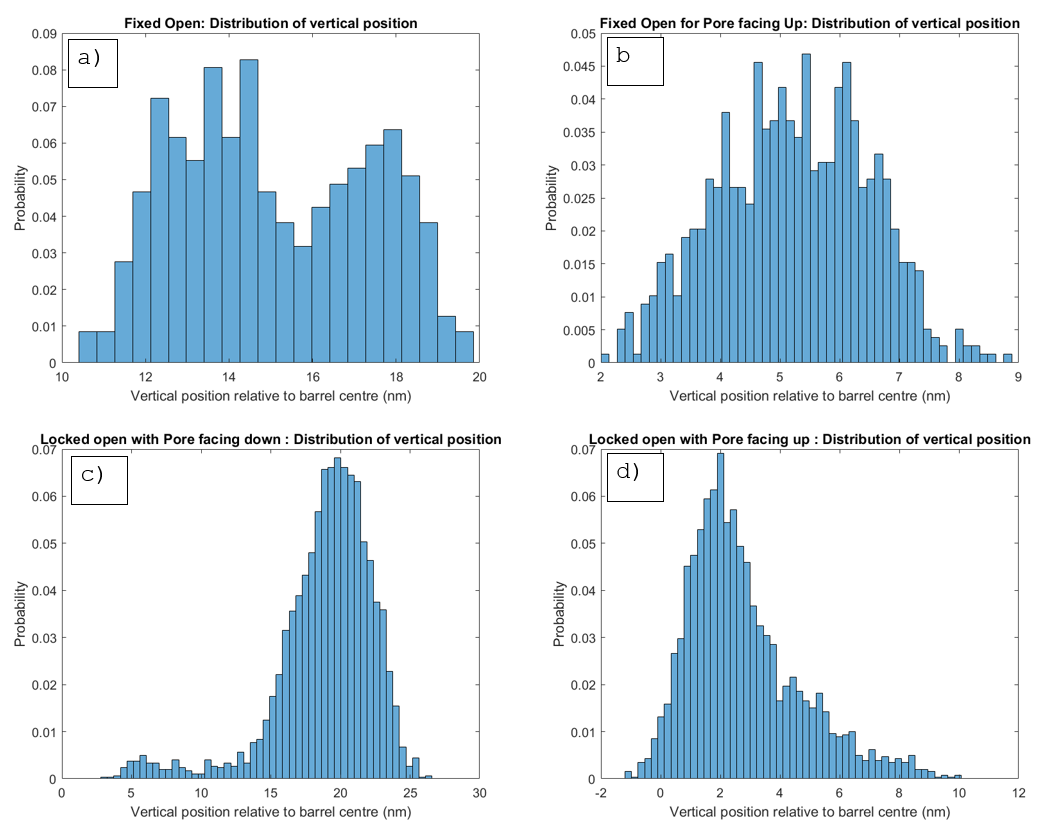
These simulations highlighted a limitation of the destruction states that needs to be accounted for in future designs. The nanopore can fold with either the pore facing up or pore facing down. In the destruction states the pore must be facing down penetrate the membrane. It is possible to enter both states with the pore facing up. However once in these states the cable does not provide the DNAlien with sufficient room to re-rotate. This suggests, that it’s better to fold the DNAlien in the unlocked state, before switching to closed, and have some closed lock staples at the bottom end of the pore as well as the cinch at the top. By using multiple locking strands, we can ensure that the pore is rotated to the correct orientation.
Fixed Open 1 (Pore facing up)
Fixed Open 2 (Pore facing up)
Locked Open
Figure 1.21. If the pore folds in the facing downwards cholesterols are held outside the barrel. If the pore folds facing upwards, then the pore remains inside the barrel.
As a transition between pore facing up and pore facing down is a rare event, it is still useful to consider the distribution once an orientation is chosen. If the pore is facing down, it is held outside the barrel as designed so is free to be inserted in lipid membrane.
For future work, we will extend simulations to studying transitions of the system from closed lock states to unlocked and unlocked to the destruction states. We will also study the inversion of the pore in the barrel (pore facing up to facing down or vice versa), to understand the frequency of such an occurrence and advise us into how best to modify the time to maximise the effectiveness of the DNAlien.
Future Work
Due to the broad scope of our project we had many ideas for ways that we could advance our design.
A particularly exciting area of future development is advancing the switching mechanism. Currently we have controlled the switching between states through adding strands but for our design to be fully realised in destruction of bacteria in the body we would either need to control this externally or by some automatic mechanism.
Using electromagnetic waves and / or electric and magnetic fields to control DNA origamis is an active area of research and is a feasible non-invasive method to activate origamis (s) [17]
Mechanisms could be attached to targeting molecules that upon binding emit light or initiate a strand displacement reaction. [18]
Propagation of signals from aptamer binding to the pore release part of the structure via molecular walkers [19]
References
[1] Douglas, S. M; Marblestone, A. H.; Teerapittayanon, S.; Vazquez, A.; Church, G.M.; Shih, W.M. Rapid prototyping of 3D DNA-origami shapes with caDNAno. Nucleic Acids Res.2009, 440, 297.
[2] Zadeh, J. N.; Steenberg, C. D.; Bois, J. S.; Wolfe, B.R.; Pierce, M.B.; Khan, A. R.; Dirks, R.M.; Pierce, N.A. NUPACK: Analysis and design of nucleic acid systems. J. Comput. Chem. 2011, 32, 170.
[3] Kim, D. N.; Kilchherr, F.; Dietz, H.; Bathe, M.; Quantitative prediction of 3D solution shape and flexibility of nucleic acid nanostructures. Nucleic Acids Res. 2012, 40, 1.
[4] Ouldridge, T. DNA nanotechnology: understanding and optimisation through simulation. Mol. Phys. 2015, 113, 1.
[5] Nadrian, S.C. Nucleic acid junctions and lattices. Journal of Theoretical Biology. 1982, 99, 237–247.
[6] Rothemund, P. W. K. Folding DNA to create nanoscale shapes and patterns. Nature. 2006, 440, 297.
[7] Castro, C. E.; Kilchherr, F.; Kim, D. N.; Lin Shiao, E.; Wauer, T.; Wortmann, P.; Bathe, B.; Dietz, D. A Primer to scaffolded DNA Origami. Nat. Methods2011, 8, 221.
[8] Zhang, D. Y.; Seelig, G.; Dynamic DNA nanotechnology using strand-displacement reactions. Nat. Chem.2011, 3, 103.
[9] Andersen, E. S.; Dong, M.; Nielsen, M. M.; Jahn, K.; Subramani, R.; Mamdouh, W.; Golas, M. M.; Sander, B.; Stark, H.; Oliveira, C. L. P.; Pedersen, J. K.; Birkedal, V.; Besenbacher, F.; Gothelf, K. V.; Kjems, J. Self-assembly of a nanoscale DNA box with a controllable lid. Nature2009, 459, 73.
[10]Douglas, S. M.; Bachelet, I.; Church, G. M. A Logic-Gated Nanorobot for Targeted Transport of Molecular Payloads. Science2012, 335, 831–834.
[11] Ponnuswamy, N.; Bastings, M. M. C.; Nathwani, B.; Ryu, J. H.; Chou, L. Y. T.; Vinther, W.; Li, W. A.; Anastassacos, F. M.; Mooney, D. J.; Shih, W. M.; Oligolysine-Based Coating Protects DNA Nanostructures from Low-Salt Denaturation and Nuclease Degradation. Nat. Commun.2017, 8, 1.
[12] Li, S.; Jiang, Q.; Liu, S.; Zhang, Y.; Tian, Y.; Song, C.; Wang, J.; Zou, Y.; Anderson, G. J.; Han, J.-Y., et al. A DNA nanorobot functions as a cancer therapeutic in response to a molecular trigger in vivo. Nat. Biotechnol.2018, 36, 258-264.
[13] Torres-Chavolla, E.; Alocilja, E. C. Aptasensors for detection of microbial and viral pathogens. Biosens. Bioelectron.2009, 24, 3175–3182.
[14] Burns, J. R.; Göpfrich, K.; Wood, J. W.; Thacker, V. V; Stulz, E.; Keyser, U. F.; Howorka, S. Lipid‐Bilayer‐Spanning DNA Nanopores with a Bifunctional Porphyrin Anchor. Angew. Chem. Int. Ed.2013, 52 (46), 12069-12072.
[15] Langecker, M.; Arnaut, V.; Martin, T. G.; List, J.; Renner, S.; Mayer, M.; Dietz, H.; Simmel, F. C. Synthetic lipid membrane channels formed by designed DNA nanostructures. Science2013, 338 (6109), 932-936.
[16] Ohmann, A.; Li, C.-Y.; Maffeo, C.; Al Nahas, K.; Baumann, K. N.; Göpfrich, K.; Yoo, J.; Keyser, U. F.; Aksimentiev, A. A synthetic enzyme built from DNA flips 107 lipids per second in biological membranes. Nat. Commun.2018, 9 (1), 2426.
[17] Kopperger, E.; List, J.; Madhira, S.; Rothfischer, F.; Lamb, D. C.; and Simmel, F. C.; A self-assembled nanoscale robotic arm controlled by electric fields. Science2018, 359, 296–301.
[18] Kuzyk, A.; Yang, Y.; Duan, X.; Stoll, S.; Govorov, A. O.; Sugiyama, H.; Endo, M.; Liu, N. A light-driven three-dimensional plasmonic nanosystem that translates molecular motion into reversible chiroptical function. Nat. Commun.20167, 10591.
[19] Wickham, S. F. J.; Endo, M.; Katsuda, Y.; Hidaka, K.; Bath, J.; Sugiyama, H.; Turberfield, A. J. Direct observation of stepwise movement of a synthetic molecular transporter. Nat. Nanotechnol.2011, 6, 166–169.
Raw Data
Access the raw data for gels here (click to download).
Access the raw data for simulations here (click to download).
Nanopore Assembly
Background
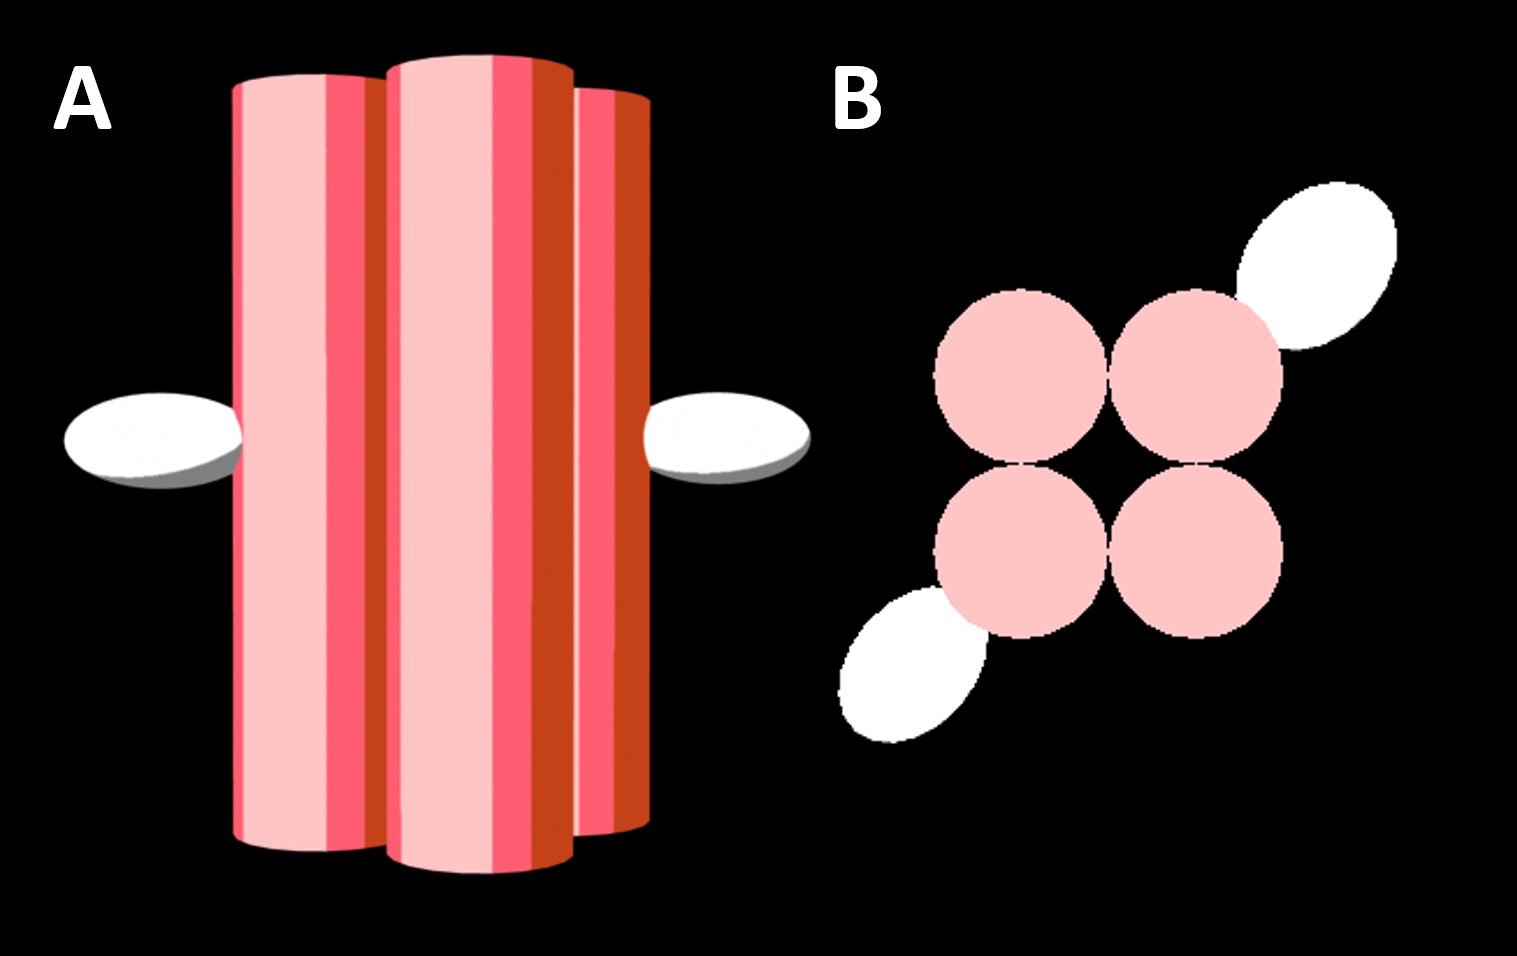
The four-helix bundle (4HB) is a DNA nanostructure that has been shown to perturb biological membranes [1]. Eight strands of DNA fold to form a four-helix structure that inserts across lipid bilayers to form a toroidal pore (Figure 2.1). The 4HB features three variants differing in the number of conjugated cholesterol moieties; 4HB.0C, 4HB.1C and 4HB.2C with respectively no cholesterol, 1 cholesterol and 2 cholesterols. In previously published work, 4HB.2C was the only variant to successfully function as a membrane pore. It was hypothesised that this is because two cholesterol tags are required to anchor the structure into the membrane via hydrophobic interactions on an otherwise hydrophilic DNA structure [1]. Since membrane disruption by the 4HB is well characterised, it is the first candidate for our design. Our first steps were to reproduce this design, and optimise the yield and folding purity.
Figure 2.1. A representation of the four helix bundle two cholesterol variant (4HB.2C), a functional DNA nanopore (a: side view and b: top view). DNA helices are represented as red cylinders while the hydrophobic cholesterol groups facilitating anchoring into lipid membranes is represented as white ovals. This model is of the design created by Ohmann et al., 2018 [1].
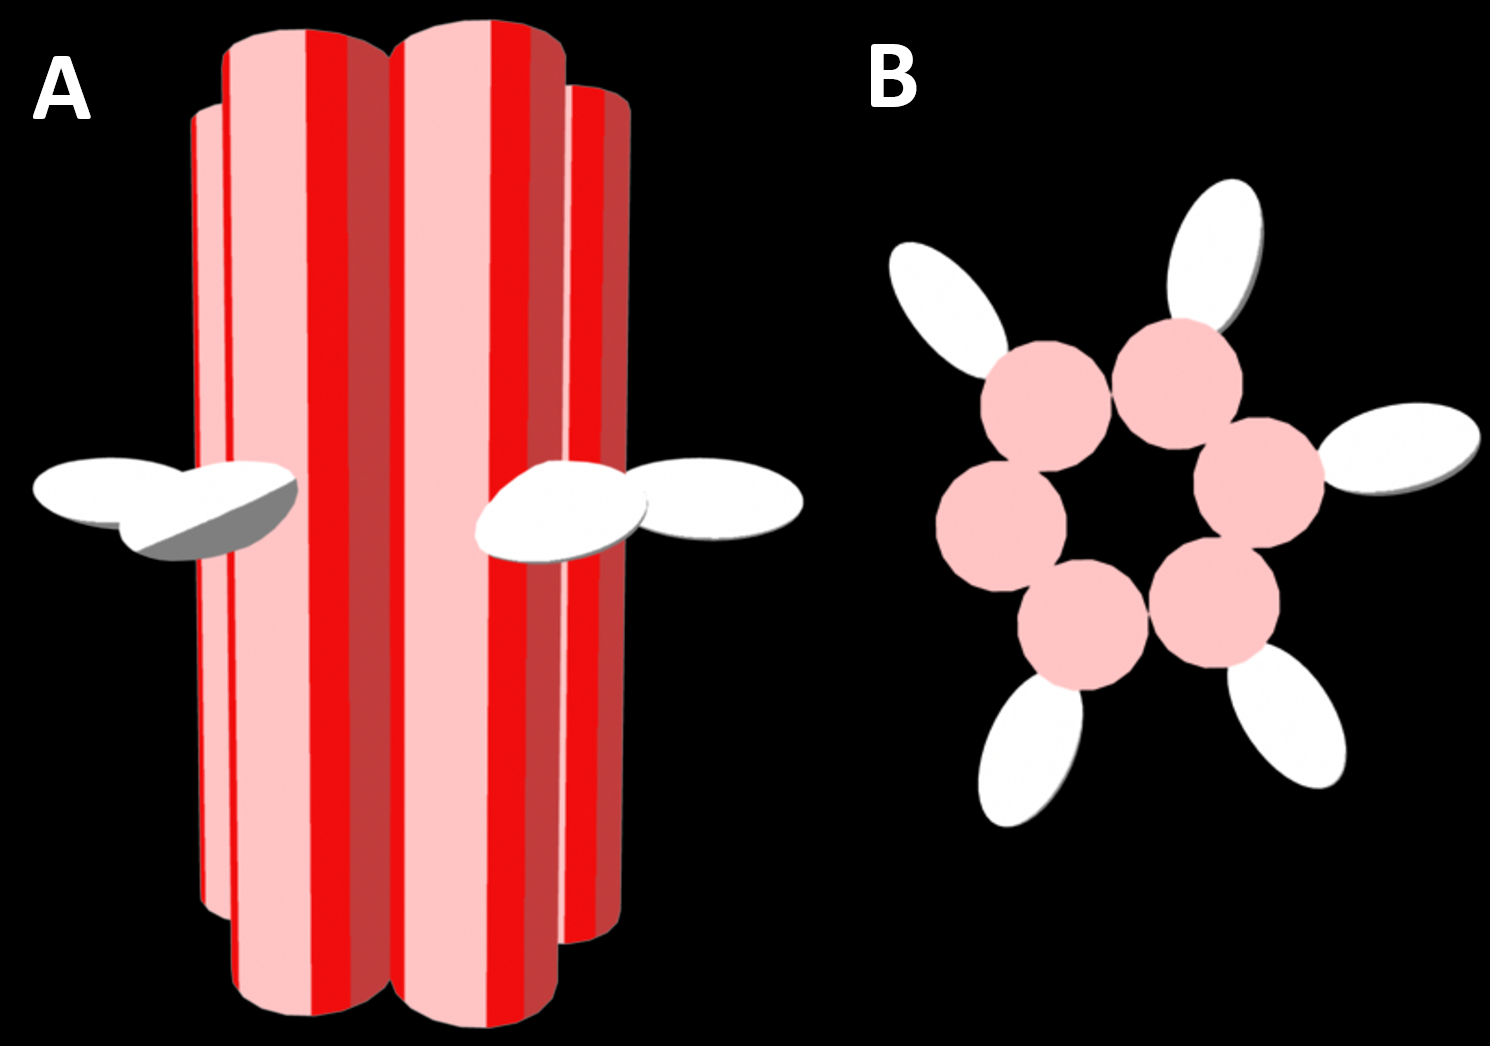
Larger DNA nanopores, featuring six DNA helices, have also been reported in literature. Ionic current measurements have been used to confirm transmembrane insertion of this structure [2]. We designed a new variant of the six-helix bundle (6HB) because the larger pore is expected to lead to greater leakage of cellular components. We hypothesise that greater leakage will achieve greater bacterial destruction (Figure 2.2). The 6HB design we used is based on an existing six-helical DNA nanostructure [3], which has a different scaffold and staple routing to the 6HB used in [2]. The 6HB used in previous membrane studies has two porphyrin tags [2] Instead of the porphyrin tags, we used five cholesterol molecules, because cholesterol modified DNA strands are commercially available. Our 6HB consists of 12 DNA strands that fold together, details about the design can be found here.
Figure 2.2. A representation of the six helix bundle decorated with five cholesterol molecules (a: side view and b: top view). DNA helices are represented as red cylinders while the hydrophobic cholesterol groups are represented as white ovals.
Aims
To optimise the folding of existing 4HB.2C design by considering DNA concentration, folding time and concentration of MgCl2 folding buffer.
To show the new 6HB design can fold correctly into a nanopore.
Methods
General Protocol for 4HB.0C
The reported protocol involved the folding of all DNA strands (0.1 µM for each strand, strands 1-8) in MgCl2 (20 mM) for 18 h in a PCR machine (heating to 80° for 5 min, cooling down to 65° using a linear cooling ramp over 75 min, subsequently cooling to 25° within 16 h). BlueJuice loading buffer (Life Tech) was added to folded samples, and the solution loaded onto a native PAGE (10% acrylamide, 11 mM MgCl2, 0.5 x TBE, 0.1% APS, 0.1% TEMED) for 60-90 min at 100 V in tris-borate-EDTA buffer (11 mM MgCl2). The gel was stained with SyBr Gold and imaged using a ChemiDocTM gel imaging system. This general protocol was varied to identify the optimal conditions of folding.
Stepwise folding of 4HB.0C
To verify the successful folding of the structure, a stepwise protocol was performed. The general protocol was varied whereby folding was performed with only strand 1 (0.1 µM) and repeated for strands 1-2 (0.1 µM), strands 1 -3 (0.1 µM), strands 1 - 4 (0.1 µM), strands 1 - 5 (0.1 µM), strands 1 - 6 (0.1 µM), strands 1 - 7 (0.1 µM) and finally all 8 strands (0.1 µM).
Comparison of 4HB.0C, 1C, 2C
The general protocol of 4HB.0C was identical for the other variants of 4HB, except for the substitution of strands with their cholesterol-tagged equivalents. 4HB.1C used a cholesterol tagged equivalent of Strand 2. 4HB.2C folding used cholesterol tagged equivalents of strands 2 and 4.
Optimisation of DNA concentration
Total DNA concentration
The general protocol was followed for all three variants of 4HB, except final folding concentration of DNA strands were varied; 0.1 µM, 1 µM and 10 µM. After folding was complete, 1 µM was diluted 1/10 and 10 µM was diluted 1/100 prior to loading. This normalisation is required to give a representation of % yield; accounting for the different starting amounts of DNA.
Strand Ratio
The general protocol was followed for 4HB.2C, except the concentration of all strands without cholesterol were increased to 0.5 µM.
The general protocol was followed for 4HB.2C, except the concentration of all strands with cholesterol were increased to 0.5 µM.
Optimisation of folding time
The general protocol was followed for 4HB.0C, except the folding time was varied; 10 min, 1 h, 2 h and 18 h. Samples were normalised to 0.2 µM prior to loading.
Optimisation of Mg2+ folding buffer
The general protocol was followed for 4HB.0C, except the folding time (was changed to 2 h) and the final folding MgCl2 concentration was varied; 5 mM, 10 mM, 20 mM, 30 mM. Samples were normalised to 0.1 µM DNA prior to loading.
General Protocol for 6HB
Equimolar concentrations of the 12 DNA strands (0.1 µM) were folded in MgCl2 (12 mM and 20 mM) for 18 h in a PCR machine (heating to 65C for 15 min and then decreasing from 50°C to 40°C over 18 h). BlueJuice loading buffer (Life Tech) was added to folded samples, with the solution then loaded onto a native PAGE (8% acrylamide, 11 mM MgCl2, 1 x TBE, 0.1% APS, 0.1% TEMED) for 2 h at 100 V in tris-borate-EDTA buffer (11 mM MgCl2). The gel was stained with SyBr Gold and imaged using a ChemiDocTM gel imaging system.
Stepwise folding of 6HB
To verify the successful folding 6HB at 0.1 µM, a stepwise protocol was performed with MgCl2 (12 mM and 20 mM). In the design of the 6HB, six of the 12 DNA strands are considered staple strands and the other six are considered scaffold strands. The staple strands were pooled and folding was performed on just staples, staples and addition of two scaffold strands, staples and addition of four scaffold strands and finally all 12 strands.
Results
Proof of successful folding
Stepwise folding of 4HB.0C
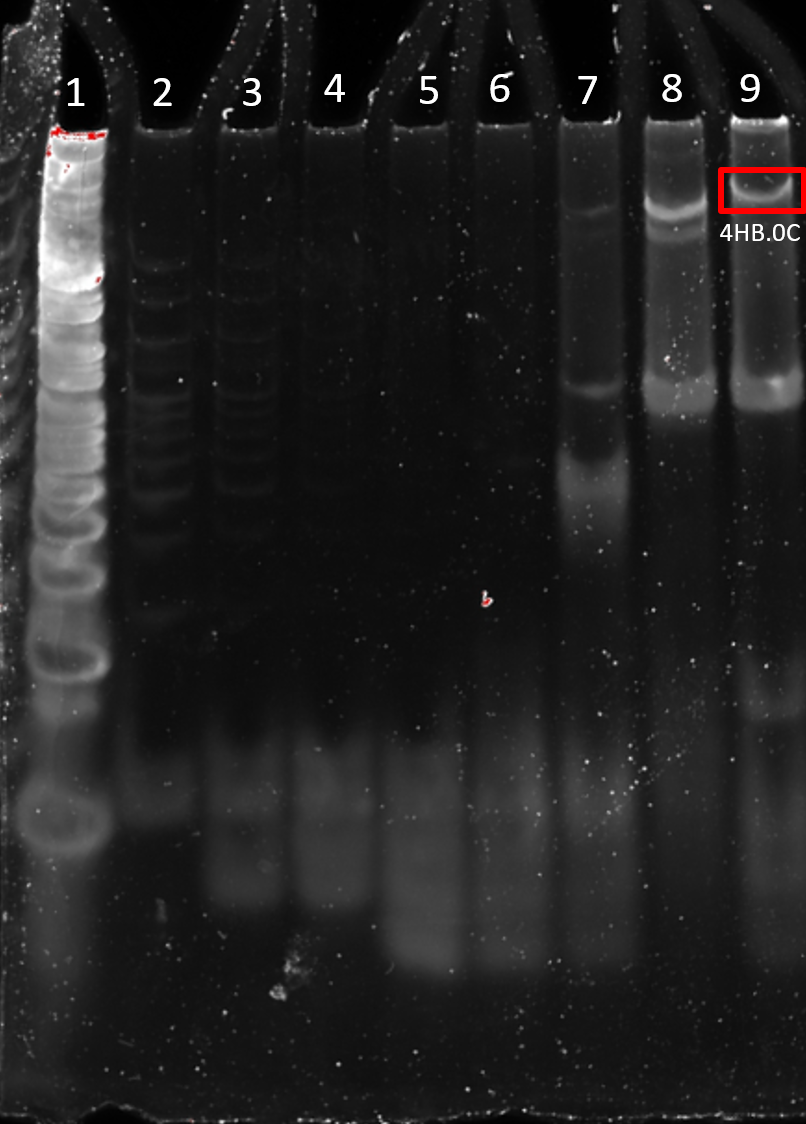
The loose strands quickly move to the bottom of the gel (Figure 2.3). A band of higher molecular weight was observed on the addition of strands 1-6, indicating a structure has folded. The structure formed by strands 1-7 has an increased weight as does the structure formed by strands 1-8, as expected by the incorporation of more DNA to the folded structure (Figure 2.3).
Figure 2.3. Stepwise folding of 4HB 0C. 10% PAGE (11 mM MgCl2) run for 90 min at 100 V. Lane 1: 25 bp ladder, Lane 2: Strand 1, Lane 3: Strand 1 – 2, Lane 4: Strand 1 – 3, Lane 5: Strand 1 – 4, Lane 6: Strand 1 – 5, Lane 7: Strand 1 – 6, Lane 8: Strand 1 – 7, Lane 9: Strand 1 – 8.
Comparison of 4HB.0C, 1C, 2C
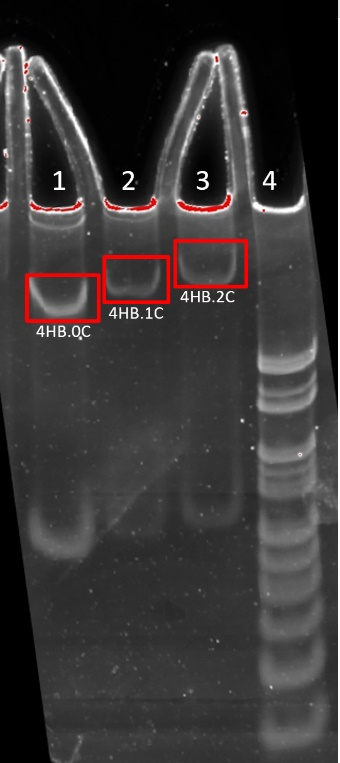
The cholesterol moiety increases the molecule weight of the structure and hence reduces the distance of the band down the gel. This difference in molecular weight is observed where by 4HB.0C travels further than 4HB.1C and 4HB.2C. 4HB.2C travels the least distance as it has the highest molecular weight (Figure 2.4).
Figure 2.4. Comparison of 4HB.0C, 4HB.1C, 4HB.2C. 8% PAGE (11 mM MgCl2) run for 2 h at 100 V. Structures were folded at 10 uM concentration of DNA strands and loaded sample normalised to 0.1 uM. Lane 1: 4HB.0C, Lane 2: 4HB.1C, Lane 3: 4HB.2C, Lane 4: 25 bp ladder.
Optimisation of DNA concentration
Total DNA concentration
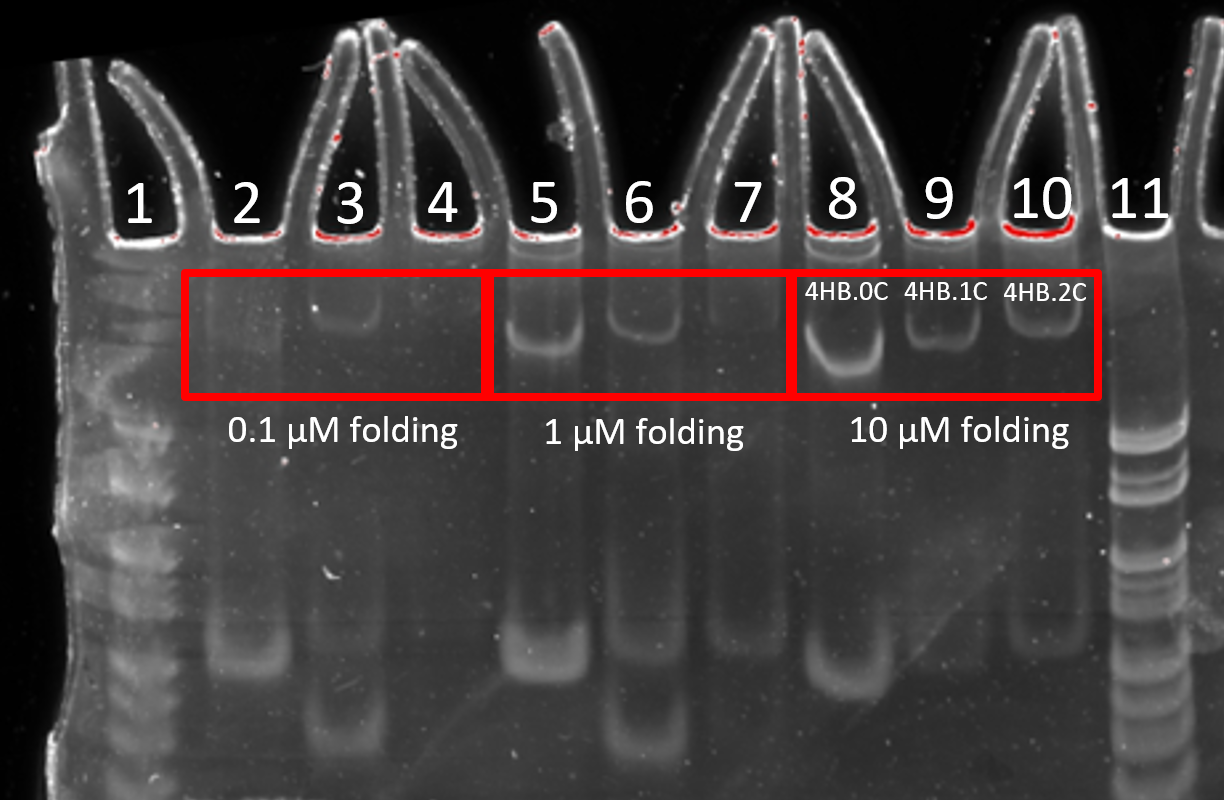
The optimum folding concentration was determined to be 10 uM for all three 4HB variants; 0C, 1C and 2C. The 10 uM folding condition lead to a more intense band, indicating a higher folding yield, compared to the 0.1 and 1 uM conditions after normalisation of loading concentration.
Figure 2.5. Comparison of DNA folding concentration. 8% PAGE (11 mM MgCl2) run for 2 h at 100 V. Structures were folded at 0.1, 1 or 10 µM and not diluted, diluted 1/10 and diluted 1/100 respectively prior to loading onto gel. Lane 1: 25 bp ladder, Lane 2: 4HB0C folded at 0.1 µM, Lane 3: 4HB1C folded at 0.1 µM, Lane 4: 4HB2C folded at 0.1 µM, Lane 5: 4HB0C folded at 1 µM, Lane 6: 4HB1C folded at 1 µM, Lane 7: 4HB2C folded at 1 µM, Lane 8: 4HB0C folded at 10 µM, Lane 9: 4HB1C folded at 10 µM, Lane 10: 4HB2C folded at 10 µM, Lane 11: 25 bp ladder.
Strand Ratio
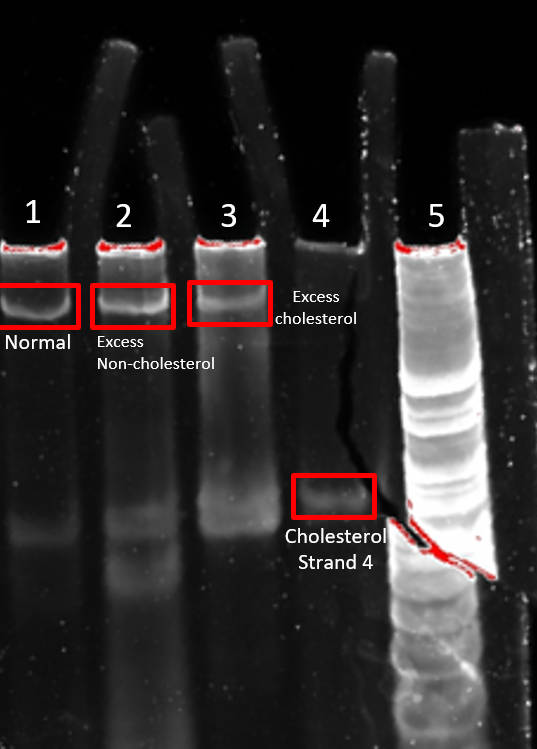
Altering the strand ratio did not significantly increase the yield of 4HB.2C whereby bands were of relatively similar brightness (Figure 2.6). Furthermore, both excess cholesterol strands and excess non-cholesterol strands lead to increased smearing observable in the gel. This smearing can indicate the presence of incorrectly folded nanostructures in the sample.Consequently, equimolar amounts of each DNA strand were chosen for subsequent experiments.
Figure 2.6. Altering strand ratio in 4HB.2C folding. 8% PAGE (11 mM MgCl2) run for 90 min at 100 V. 4HB.2C was folded according to its general protocol, except some strands were added in excess. Lane 1: Normal strand ratio, Lane 2: 5x Excess non-cholesterol (strands 1, 3, 5-8), Lane 3: 5x Excess cholesterol (strands 2, 4), Lane 4: cholesterol strand 4, Lane 5: 25 bp ladder.
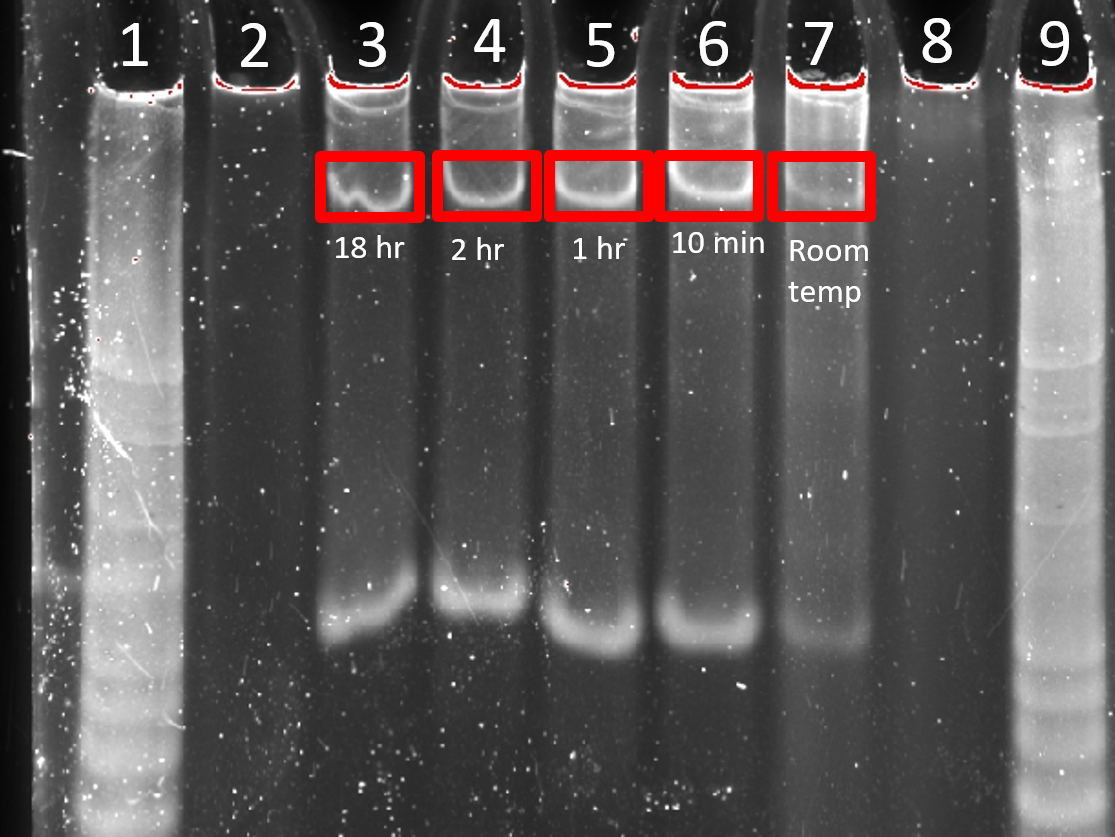
Optimisation of folding time
18 h and 2 h folding times gave bands of similar intensity and sharpness (Figure 2.7). Shorter folding times led to less sharpbands and a greater degree of smearing on the gel indicating aggregates and misfolded structures. Leaving the DNA strands at room temperature without any PCR folding protocol gave a very poor yield of 4HB. 2 h was chosen as the folding time for subsequent experiments for convenience.
Figure 2.7. Comparison of 4HB.0C folding time. 8% PAGE (11 mM MgCl2) run for 2 h at 100 V. Samples were normalised to 0.2 µM prior to loading. Lane 1: 25 bp ladder, Lane 2: 0.2 µM Strand 4, Lane 3: 18 h, Lane 4: 2 h, Lane 5: 1 h, Lane 6: 10 min, Lane 7: left at room temperature without folding, Lane 8: 0.2 µM Strand 4, Lane 9: 25 bp ladder.
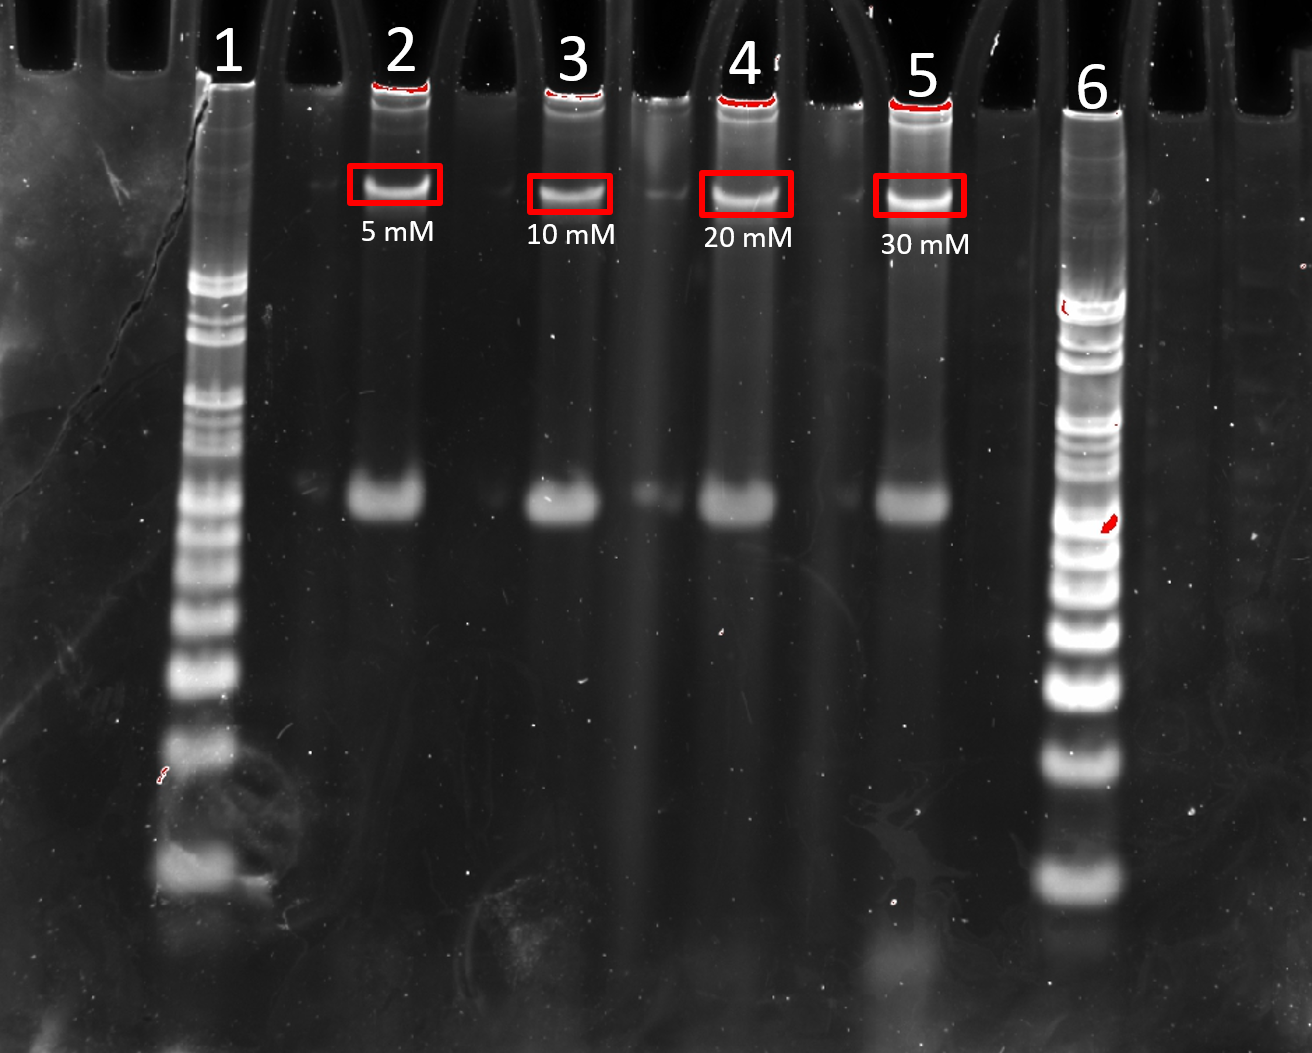
Optimisation of MgCl2 folding buffer
Divalent cations, such as Mg2+, stabilise folded DNA nanostructures by shielding the electrostatic repulsion between the negative phosphate backbones of DNA helices in densely packed structures. It was expected that lower MgCl2 would give lower folding yield of 4HB. This was observed where 5 mM MgCl2 lead to a slightly dimmer band (Figure 2.8). No significant differences in sharpness or brightness were noticeable between 10, 20 and 30 mM MgCl2, however 30 mM showed greater aggregation and smearing. The reported concentration of 20 mM MgCl2 in [2] was therefore maintained. Since lower MgCl2 concentration is favourable in the functioning of the Liposome Transport Assay, 10 mM MgCl2 was also used in subsequent experiments .
Figure 2.8. Comparison of 4HB.0C MgCl2 folding buffer concentration. 8% PAGE (11 mM MgCl2) run for 2 h at 100 V. Samples were normalised to 0.1 µM prior to loading. Lane 1: 25 bp ladder, Lane 2: 5 mM MgCl2, Lane 3: 10 mM MgCl2, Lane 4: 20 mM MgCl2, Lane 5: 30 mM MgCl2, Lane 6: 25 bp ladder.
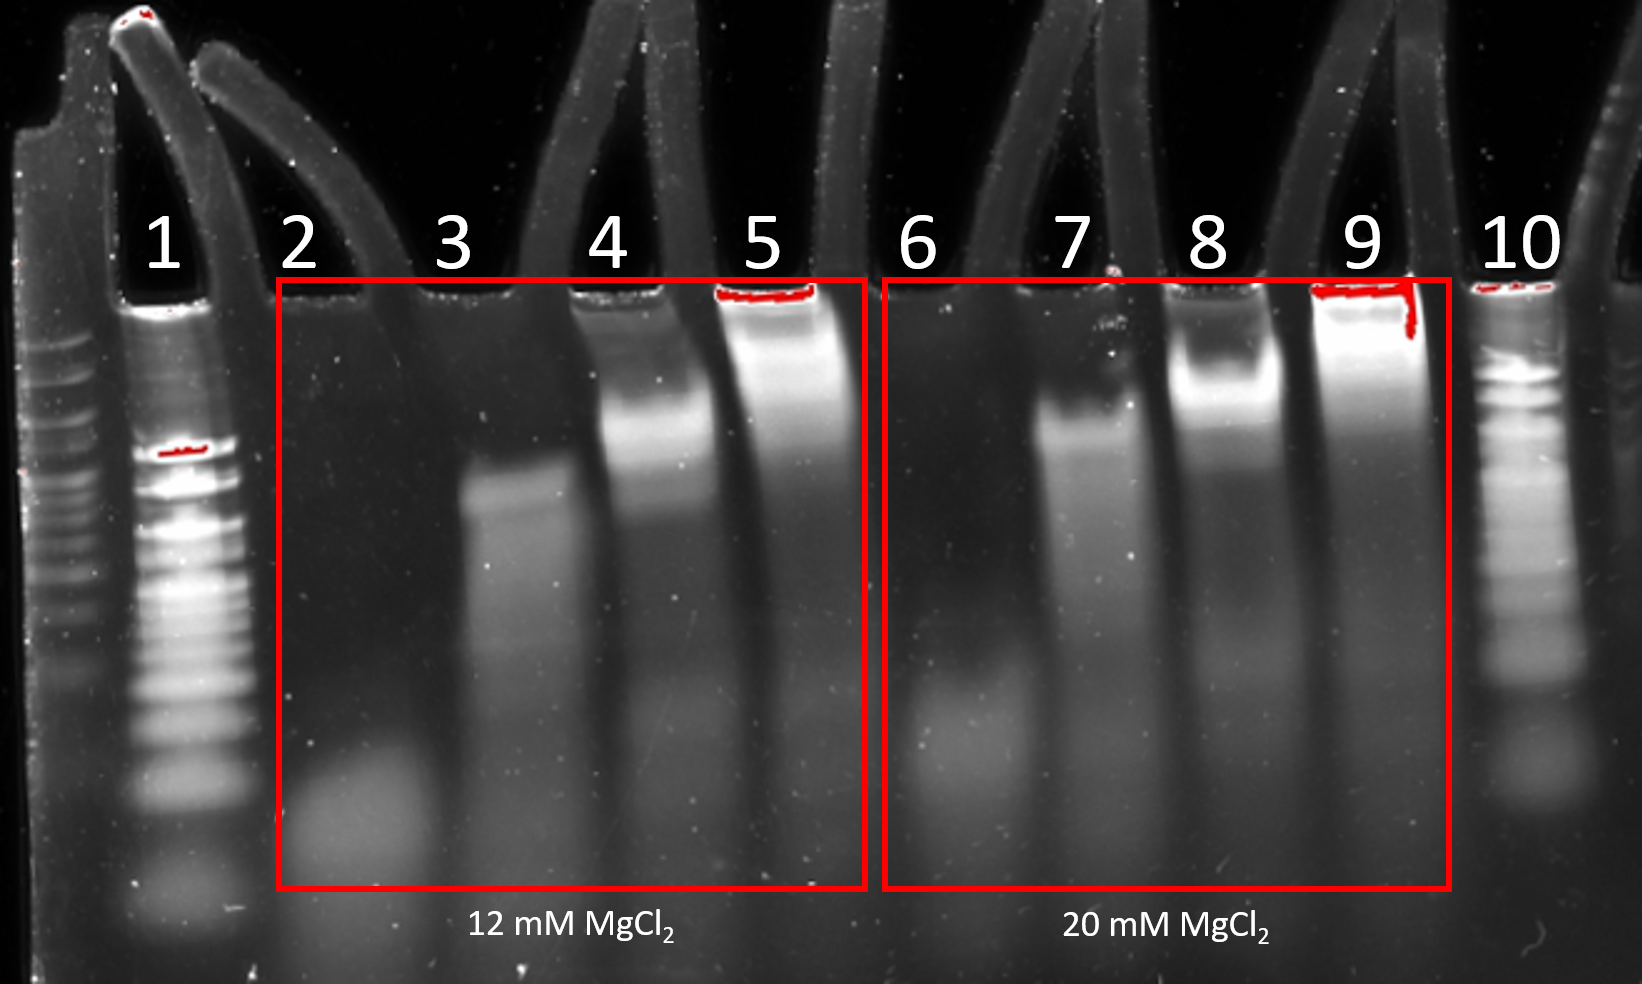
6HB Proof of Folding
Figure 2.9. Stepwise folding of 6HB. 8% PAGE (11 mM MgCl2) run for 2 h at 100 V. Lane 1: 25 bp ladder, Lane 2: staples (MgCl2, 12 mM), Lane 3: staples + 2 scaffold strands (MgCl2, 12 mM), Lane 4: staples + 4 scaffold strands (MgCl2, 12 mM), Lane 5: staples + 6 scaffold strands (MgCl2, 12 mM), Lane 6: staples (MgCl2, 20 mM), Lane 7: staples + 2 scaffold strands (MgCl2, 20 mM), Lane 8: staples + 4 scaffold strands (MgCl2, 20 mM), Lane 9: staples + 6 scaffold strands (MgCl2, 20 mM), Lane 10: 25 bp ladder.
The 6HB was determined to have folded from the PAGE (Figure 2.9). The unfolded loose strands move faster through the gel. When scaffold strands are incorporated , slower bands were observed in the gel, corresponding to larger structures (Figure 2.9). An additional slower band appears for each of the four steps in the stepwise addition, indicating that the 12 strands of DNA are folded together, all are incorporated into the final structure. The bands for 6HB folded at MgCl2 20 mM are brighter and less diffuse than the ones folded at MgCl2 12 mM, indicating that 20 mM MgCl2 is a better folding buffer concentration for the 6HB.
Discussion
The DNA strand concentration of 10 µM was determined to be optimum in the folding of all three variants of 4HB, with adding strands in excess having no significant improvement in yield. The folding time of 2 h gave comparable results to 18 h for the 4HB.0C and other MgCl2 concentrations did not significantly improve results at 20 mM MgCl2. Further optimisation could be performed by combining the variables, for example examining different MgCl2 concentrations at the 2 h folding time. Due to the limitations in quantities of cholesterol tagged DNA the optimisation was performed for 4HB.0C and assumed to correspond to 4HB.2C. It is expected that the cholesterol moieties would not significantly affect the nature of 4HB folding, but further work is required to confirm this. The success of this optimisation could be confirmed further by directly comparing the reported literature conditions against the optimised conditions.
The new structure 6HB was successfully folded as the stepwise addition shows incorporation of all DNA scaffold strands (Figure 2.9). The folding of 6HB like 4HB is optimal at higher MgCl2 concentrations with higher intensity bands for samples folded at 20 mM MgCl2 over 12 mM. Future work will include optimisation of folding conditions for the 6HB to determine whether higher DNA strand concentrations can be used and the 6HB variant decorated with cholesterol molecules will be folded (Figure 2.10).
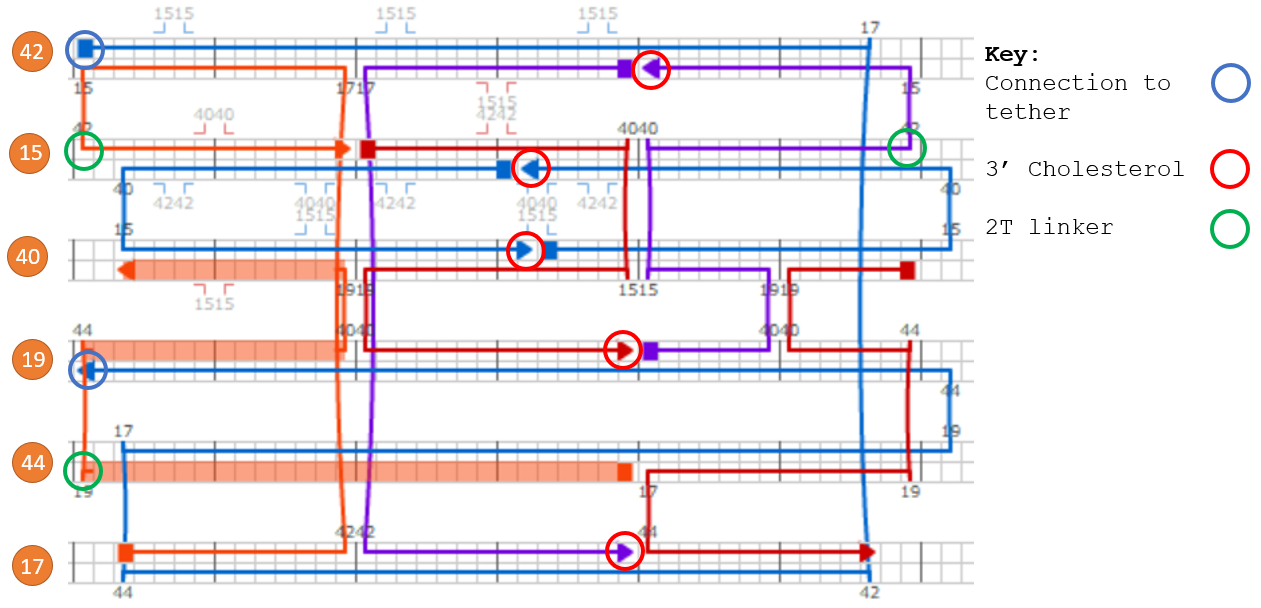
Figure 2.10. Cadnano designs for 6HB design decorated with cholesterol molecules.
Conclusion
The folding conditions of the existing 4HB.0C design were successfully optimised to 10 uM DNA concentration, 2 hr folding time and 20 mM MgCl2. These conditions were applied to 4HB.2C folding in further work. The new 6HB design was successfully folded with 20 mM MgCl2 folding buffer, 0.1 uM DNA concentration and 18 h 50-40 °C folding ramp.
References
[1] Ohmann, A.; Li, C.-Y.; Maffeo, C.; Al Nahas, K.; Baumann, K. N.; Göpfrich, K.; Yoo, J.; Keyser, U. F.; Aksimentiev, A. A synthetic enzyme built from DNA flips 107 lipids per second in biological membranes. Nat. Commun.2018, 9 (1), 2426.
[2] Burns, J. R.; Göpfrich, K.; Wood, J. W.; Thacker, V. V.; Stulz, E.; Keyser, U. F.; Howorka, S. Lipid-Bilayer-Spanning DNA Nanopores with a Bifunctional Porphyrin Anchor. Angew. Chem. Int. Ed.2013,52 (46), 12069-12072.
[3] Douglas, S. M.; Chou, J. J.; Shih, W. M. DNA-nanotube-induced alignment of membrane proteins for NMR structure determination. PNAS2007, 104, 6644–6648.
Membrane spanning DNA nanopores have previously been tested with a range of techniques [1-3]. One such technique is current-voltage recordings across lipid bilayers to measure ion conductance of nanopores [1,2]. By looking at current traces at a constant voltage, changes in current may indicate nanopore insertion into lipid bilayers to an ion conducting orientation [2]. Confocal fluorescence microscopy has also been used to spatially determine nanopore and giant unilamellar vesicle interactions [2,3]. A dithionate reduction assay has also been able to probe for lipid scrambling induced by DNA nanopores, where flipping of lipids from one leaflet to the next can be observed via changes in fluorescence [3].
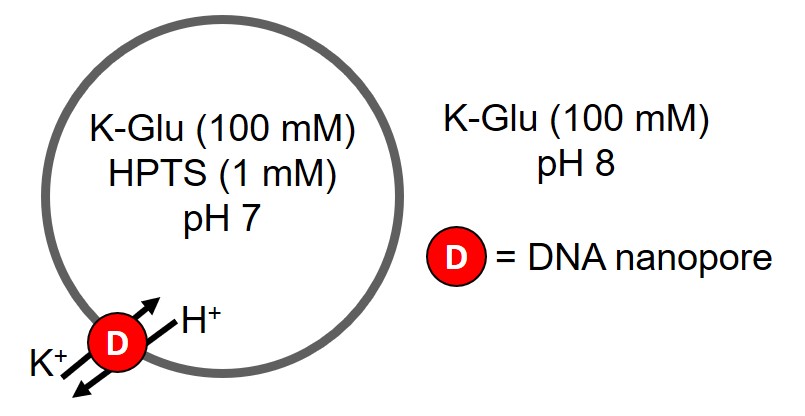
We used a known assay that tests the leakage ability of nanopores using synthetic POPC liposomes as a model for cells and fluorescence to monitor changes in liposome content [4]. The advantage of this assay is that it can be used to elucidate the identity of ions that can pass through our DNA nanopores. A pH gradient is setup where the pH inside the liposomes is pH 7 and the external solution is pH 8 (Figure 3.1 and 3.2). Once a nanopore is added this will allow the pH gradient to dissipate, that is protons are moved out of the liposomes to equilibrate the pH of the internal and external solutions. There are two possible mechanisms for this (Figure 3.1 and 3.2).
Figure 3.1. HPTS liposome assay for an electroneutral nanopore. Assay will progress and dissipate pH gradient if DNA nanopore can transport both protons and potassium ions. Adapted from [4].
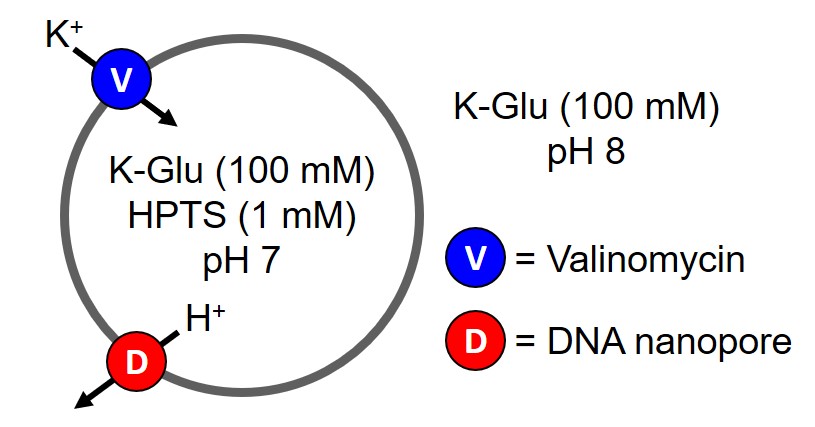
Figure 3.2. HPTS liposome assay for electrogenic transporter. Valinomycin is added to the assay to maintain membrane potential by transporting potassium ions into liposomes as DNA nanopore transports protons out of liposomes. Adapted from [4].
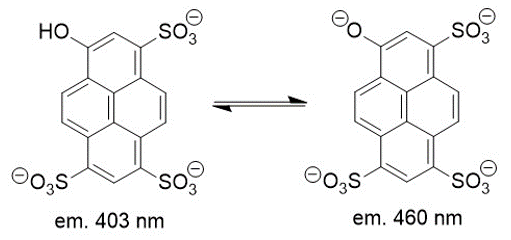
pH of the liposomes can be monitored with 8-Hydroxypyrene-1,3,6-trisulfonic acid trisodium salt (HPTS), a ratiometric fluorophore that can detect changes in pH through the protonation equilibrium of the hydroxyl of HPTS (Figure 3.3) [5]. pH changes can be detected via fluorescence as the protonated form of HPTS results in greater emission at 403 nm and greater emission at 460 nm for the deprotonated form. By taking the ratio of fluorescence emission intensity at 460 nm and 403 nm, proton efflux from the liposomes can be detected and thus the transport abilities of the nanopore can be determined [4]
To determine whether the DNA nanopores can transport molecules across lipid membranes. To determine what molecules can be transported through the DNA nanopore.
Methods
1-palmitoyl-2-oleoyl-glycero-3-phosphocholine (POPC) was dissolved in chloroform. POPC in chloroform was dehydrated and dried overnight in a vacuum desiccator. An internal solution of potassium gluconate (K-Glu) (100 mM) and 8-Hydroxypyrene-1,3,6-trisulfonic acid trisodium salt (HPTS) (1 mM) was prepared at pH 7. The lipid was rehydrated with the internal solution and vortexed for 10 min. The lipid was freeze thawed nine times with liquid nitrogen to create un-uniform liposomes. Liposomes were size extruded through a 200 nm polycarbonate filter 25 times to afford uniform 200 nm unilamellar liposomes. An external solution of potassium gluconate (100 mM) was prepared at pH 7. Liposomes were run through a Sephadex-50 size extrusion column with the external solution to remove any HPTS not encapsulated by the liposomes.
For the assay, liposomes (0.1 mM POPC) were suspended in the external solution. Various concentrations of DNA nanopore 4-helix bundle (4HB) were added (0.1 - 1mol%) and potassium hydroxide to raise external solution to pH 8. DNA samples was incubated with liposomes for 20 - 120 min. To start assay, valinomycin (0.05 mol%) was added at time 10s and fluorescence at 460 nm and 403 nm was monitored over 12 min. Valinomycin is a known potassium transporter and starts the assay by transporting of potassium ions into the liposomes to maintain charge potential across lipid bilayer. At 10 min, detergent was added to lyse liposomes and fluorescence at 460 nm and 403 nm was monitored for a further 12 min. This assay was repeated with a known proton transporter, carbonyl cyanide m-chlorophenyl hydrazone (CCCP) as a positive control, and with free DNA strands tagged with cholesterol as a negative control.
Results
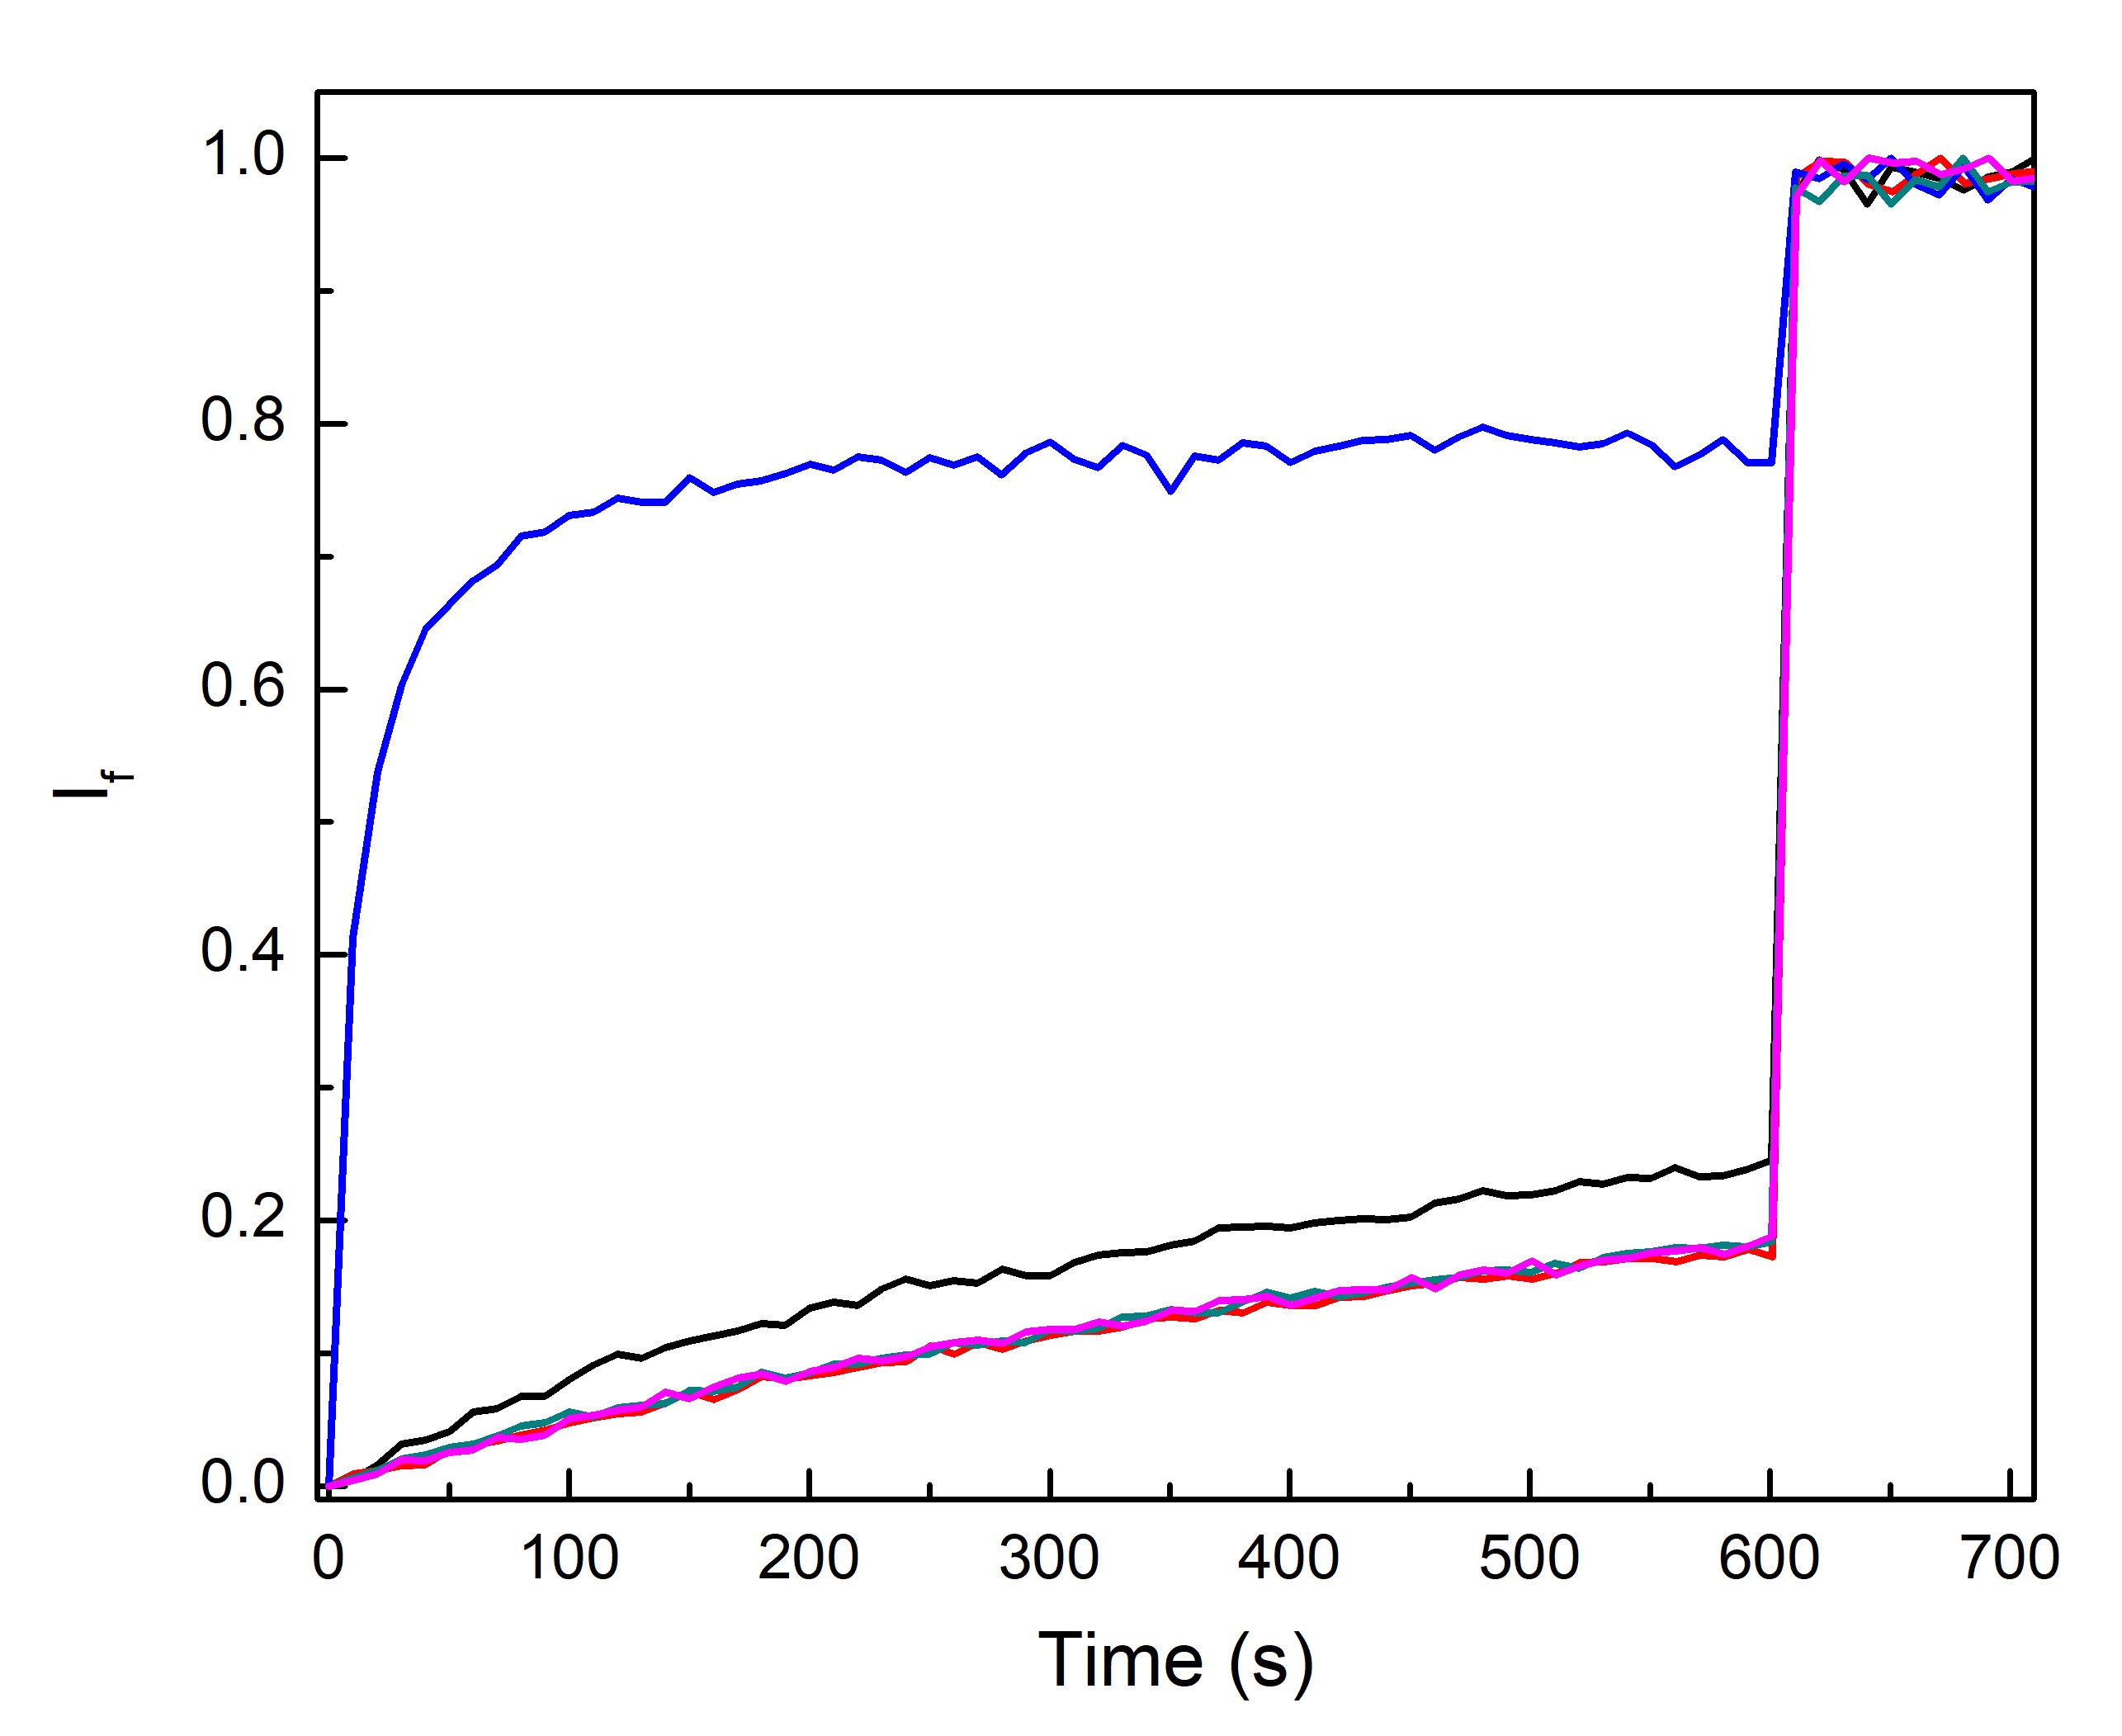
Figure 3.4. HPTS fluorescence transport assay performed on POPC liposomes (200 nm) with an internal solution of K-Glu (100 mM) and HPTS (1 mM) pH 7 and suspended in an external solution of K-Glu (100 mM) pH 8. Fluorescence was monitored at 460 nm and 403 nm at 25°C, where If is the normalised ratiometric fluorescence intensity (460 nm/403 nm). DNA nanopore 4HB was incubated with liposomes for 20 min before assay was started with valinomycin (0.05 mol%) added at time 10 s. 4HB 1 mol% (black), 4HB 0.1 mol% (red), unfolded DNA-chol strand 0.1 mol% (green), CCCP 0.1 mol% (blue), no DNA, folding buffer (20 mM MgCl2) (pink).
Discussion
The liposome assay showed that 4HB was able to dissipate the pH gradient in the presence of valinomycin (Figure 3.4), which indicates the ability of the nanopore to transport protons out of the liposomes (Figure 3.2). Since the assay did not run when valinomycin was not added, this suggests that the pore is not capable of transporting potassium ions (Figure 3.1). Transport of potassium ions into the liposomes are required for protons to be transported out because this maintains the electrical potential across the lipid bilayer. When potassium ions are not transported into the liposomes charge build up across the lipid bilayer stops further proton efflux. We hypothesis that the 4HB nanopore cannot transport potassium ions because the central channel of the 4HB is too small (2.4 nm). An alternative mechanism to dissipate the pH gradient is the transport hydroxide into the liposomes, however this mechanism is expected to be less likely due to electrostatic repulsion between the negatively charged hydroxide and DNA.
Liposomes were lysed at 10 min to release HPTS and fluorescence was monitored for an additional 2 min to show fluorescence at time where pH between the internal and external liposome solutions have equilibrated. CCCP is a known proton transporter and was used as a positive control in this experiment. Free DNA strands tagged with cholesterol were added as a negative control to show unfolded DNA does not disrupt liposomes or cause transport.
Control experiments during these measurements suggested that increased concentrations of folding buffer (20 mM MgCl2, 1x tris-EDTA) may interfere with the assay. When tested against valinomycin without folding buffer, the sample containing folding buffer appeared to have greater fluorescence intensity. It is proposed that tris-EDTA can also dissipate the pH gradient either via destabilising lipid bilayers through metal ion chelation or via assisting proton transport, however further research is required to elucidate the mechanism. To compare the effect of higher DNA nanopore concentrations on transport, a buffer exchange of DNA origamis to a buffer compatible with the assay is required.
In the future, further work will be done to optimise the assay such that smaller volumes of DNA nanopore can be used. Currently, to run the assay at 1 mol% DNA nanopore to lipid, 250 μL of a 10 μM sample is required. If the assay could be scaled down to a plate reader many more conditions could be tested at once. Future work will also include performing other liposomes assays to test the transport ability of 4HB for other ions by switching to different internal and external liposome solutions. An ion selective electrode can also be used to monitor transport by measuring changes in concentration of a particular ion in the external solution, thus monitoring ion efflux [4]. Other pores will also be tested to determine whether larger pores can increase transport efficiency and to explore how pore shape can be used to tune selectivity in ions transported.
Conclusion
Conclusively, the DNA nanopore 4HB can create a pore in synthetic POPC liposomes to transport protons out of the liposomes but is unable to facilitate potassium ion transport. This is likely due to the pore size being too small for the larger cation.
References
[1] Langecker, M.; Arnaut, V.; Martin, T.G.; List, J.; Renner, S.; Mayer, M.; Dietz, H.; Simmel, F. C. Synthetic Lipid Membrane Channels Formed by Designed DNA Nanostructures. Science2012, 338, 932–936.
[2] Göpfrich, K.; Zettl, T.; Meijering, A. E. C.; Hernández-Ainsa, S.; Kocabey, S.; Liedl, T.; Keyser, U. F. DNA-Tile Structures Induce Ionic Currents through Lipid Membranes. Nano Lett.2015, 15 (5), 3134-3138.
[3] Ohmann, A.; Li, C.-Y.; Maffeo, C.; Al Nahas, K.; Baumann, K. N.; Göpfrich, K.; Yoo, J.; Keyser, U. F.; Aksimentiev, A. A synthetic enzyme built from DNA flips 107 lipids per second in biological membranes. Nat. Commun.2018, 9 (1), 2426.
[4] Wu, X.; Howe, E. N. W.; Gale, P. A. Supramolecular Transmembrane Anion Transport: New Assays and Insights. Acc. Chem. Res.2018, 51 (8), 1870-1879.
[5] Hakonen, A.; Hulth, S. A high-precision ratiometric fluorosensor for pH: Implementing time-dependent non-linear calibration protocols for drift compensation. Anal. Chim. Acta.2008, 606 (1), 63-71.
In DNA origami, DNA sequences are designed to such that the desired structure is thermodynamically favoured. The deterministic factor of DNA folding is base-pair complementarity; complementary bases for strands which are to bond, and anticomplementary where they are to remain exposed. By extending this basic concept, large three dimensional objects such as barrels, handles and nanopores can be designed. Although molecular modelling can give insight into likelihood of successfully folding a structure; experimental validation ultimately demonstrates the success of the design. Three structures were folded experimentally; DN2, a previously validated barrel design [1], DNAlien (no 6HB) and DNAlien (with 6HB). Our new structure the DNAlien is a modified barrel design featuring a cable in the centre that can be folded into a six helix bundle (6HB) nanpore more details of DNA design can be found here.
As previously discussed, a key variable in the folding of DNA structures is the concentration of Mg2+. Sufficient concentrations of this divalent cation are required to stabilise structures by shielding the electrostatic repulsion of the negative phosphate backbone of DNA. However, high concentrations promote the formation of aggregates and consequent loss of yield. When folding a novel structure, multiple concentrations of Mg2+ must be trialed to determine the most optimum concentration.
The determination of successful folding can be difficult using the results of an agarose gel electrophoresis alone. Purification of folded DNA occurs on agarose gels which separate based on size, where smaller fragments will travel further down the gel. It can be challenging to observe slight gel shifts between scaffold and folded DNA origami. It is far more effective to excise bands from the gel and observe the structures formed on a nanoscale. Consequently, the technique of Transmission Electron Microscopy (TEM) is employed.
TEM is an imaging technique that uses a focused beam of high energy electrons for structural analysis of samples from microns to angstrom. A two dimensional image is achieved by passing a beam of electrons through the sample and imaging the “shadow” of this. On the way through the sample some structural components will deflect or transmit the electrons more than others. This gives an effective lightening or darkening effect to more or less electron-translucent parts of the image, which equates to thickness or type of molecule. This is similar in concept to a light microscope. However, electromagnetic lenses are used to focus the electrons rather than glass lenses.
We chose to use this method of analysis as it provides information about the three dimensional structure of the DNA origami. While the 6HB pore in our DNAlien is relatively small (diameter ~7.5 nm), our aim was to observe the difference between the DNAlien folded with and without the pore by TEM.
Aims
To test the DNA strands sequences of the cinch release by studying strand displacement in PAGE.
To reproduce folding of DN2 and to show structures DNAlien (no 6HB) and DNAlien (with 6HB), can be folded. To optimise folding buffer conditions for DN2 and DNAlien.
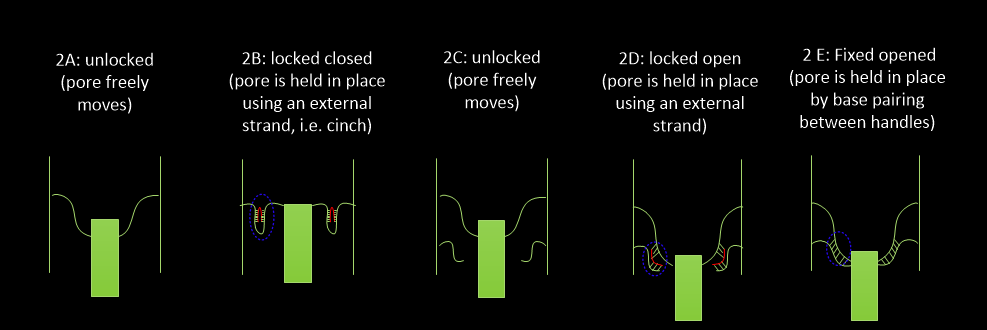
To show DNAlien (with 6HB) can be folded and exist in ‘locked closed’, ‘unlocked’, ‘locked open’ and ‘fixed open’ states and to show switchability between these states.
Methods
Displacement Strands
The cinch strand displacement was tested experimentally via PAGE. Three different sets of strand displacements were tested, each set contains three single stranded DNA strands denoted as AB, A* and B*A*. The addition of B*A* to the AB/A* duplex should displace A* and form the AB/B*A* duplex as B*A* has a greater affinity for AB than A*.
For each set of displacement strands, AB (22.2 µM) was added to A* (20 µM) and annealed for 10 min (95 °C to 25 °C). B*A* (50 µM) was added to the annealed AB/A* (10 µM) and left for 20 min at room temperature. B*A* (50 µM) was added to AB (10 µM) and annealed for 10 min (95 °C to 25 °C). These three conditions: A* + AB, A*/AB + B*A* and B*A* + AB were run on a 10% Page for 30 min at 180 V as well as each individual strand A*, AB and B*A* (10 µM).
Folding of DN2, DNAlien (no 6HB), DNAlien (with 6HB)
To verify that the barrel could still successfully fold with the 6HB, three designs were tested;
1A: a previously validated barrel design, DN2 from [1]
1B: DNAlien without the 6HB, possessing an empty loop
1C: DNAlien with the 6HB
The DNA staples used in the folding of DN2 and DNAlien can be divided into three pools: outer (O), inner middle (IM) and scaffold staples (SS). The strands responsible for folding helix 12 (H12) and helix 26 (H26) in both DN2 and the DNAlien are not included in these categorisations. H12 and H26 have different variants depending on the desired conformation of the DNAlien, hence are kept separate from the O, IM and SS pools.
1A was folded by adding p7308 scaffold (0.1 µM), DN2 strands (O, IM and SS groups, each strand at 1 µM), H12_plain (1 µM), H26_plain (1 µM) in varying MgCl2 concentrations (4, 8, 12, 16, 20, 24 mM) and 1 x tris-EDTA (TE) at 50 °C to 40 °C over 18 hr. The folded samples were purified on a 2% agarose gel (11 mM MgCl2, 0.5 x tris-borate-EDTA (TBE), Sybr Safe Stain) in running buffer (0.5 x TBE, 11 mM MgCl2) for 2.5 hr at 60 V. After visualisation on ChemiDoc, the gel was placed in a BlueBox Illuminator and the best bands were excised using a scalpel. Each excised band was placed in gel extraction spin columns and centrifuged for 15 min at 18000 g and 4 °C into collection tubes. DNA concentration of the purified sample was then measured using a nanodrop prior to TEM imaging.
1B was folded according to an identical protocol except instead of DN2 strands, DNAlien strands (O, IM and SS groups, each strand at 1 µM) was used.
1C was folded according to an identical protocol to 1B, except additional DNAlien_6HB strands (1 µM) were added. These strands are designed to fold the 6HB in the centre from the cable.
Folding DNAlien (with 6HB) in different states
DNAlien (with 6HB) was folded in five states
2A: unlocked closed
2B: locked closed
2C: unlocked open
2D: locked open
2E: fixed open
Figure 4.1. Schematic representation of DNAlien (with 6HB) folded in different conformations.
2A and 2B were folded identically to 1C in in MgCl2 (8, 12, 16, 20 mM) except cinch 1+2 (10 µM) was added to 2B.
2C and 2D were folded identically to 1C except H26_lockedO variant (1 µM) was used and cinch 3+4 (10 µM) was added to 2D.
2E was folded identically to 1C except H26_fixedO variant (1 µM) was used.
After agarose purification (as mentioned above), the best bands were excised and purified for TEM imaging or switching experimentation.
Testing switchability of DNAlien (with 6HB)
To verify that the DNAlien can be switched between different folding positions, designed DNA single strands were added to purified structures (1.5 nM) 2A-2E and incubated overnight at 25 °C.
3A: 2A (unlocked) + 100x (cinch 1+2) to switch to a locked closed state
3B: 2B (locked closed) + 100x (anti cinch 1+2) to switch to an unlocked closed state
3C: 2C (unlocked) + 100x (cinch 3+4) to switch to a locked open state
3D: 2A (unlocked) + 100x (cinch 3+4) as control, no switching should occur
Cholesterol tagged structures
4A was folded by adding p7308 scaffold (0.1 µM), DN2 strands (O, IM and SS groups, each strand at 1 µM), H12_plain (1 µM), H26_plain (1 µM) in 10mM MgCl2 and 1 x TE at 50 °C to 40 °C over 18 h. The folded samples were purified on an 2% agarose gel (11 mM MgCl2, 0.5 x TBE, Sybr Safe Stain) in running buffer (0.5 x TBE, 11 mM MgCl2) for 2.5 hr at 60 V. The best bands were excised and purified for TEM imaging. 4B was folded identical to 4A, except H12_outer handle (1 µM) was used.
4C was folded identical to 4A except DNAlien strands (O, IM and SS groups, each strand at 1 µM) were used instead of DN2. 4D was folded identical to 4C, except H12_outer handle (1 µM) was used.
4E was folded identical to 4C except DNAlien_6HB (1 µM) was added. 4F was identical to 4E, except H12_outer handle (1 µM) was used.
The structures were purified via agarose gel electrophoresis. Purified 4A - 4F were normalised to 0.6 nM before addition of cholesterol anti-handles (36 nM) and incubation overnight at room temperature. This experiment was repeated in presence of 2% octyl glucoside detergent with structures normalised to 0.5 nM before addition of cholesterol anti-handle (30 nM). Cholesterol anti-handles should hybridise to structures decorated with handles. Samples were run on 2% agarose gel (11 mM MgCl2, 0.5x tris-borate-EDTA) for 2.5 h at 60V. Samples without detergent were then images on TEM with POPC liposomes, details of liposome preparation can be found here.
TEM sample preparation
Samples for TEM were prepared by placing plasma-treated carbon coated Formvar mesh grids (Ted Pella) onto 7 microlitres of DNA origami solution on a parafilm for 3 minutes. The solution was then wicked away using a filter paper. Prior to sample preparation, the grids were plasma treated with an 80% argon 20% oxygen plasma mixture using the Gatan Solarus 950 plasma cleaner.
The grids were then stained using 2% uranyl acetate (UA) which binds with phosphate groups in the DNA backbone to create a more significant contrast of DNA containing materials to the background. This is due to the heavy Uranium providing a large dense molecule for the electrons to interact with. The grid+sample was placed onto a drop of 2% UA and the solution immediately wicked away with a filter paper. This was repeated three times for each sample/grid.
The grids were then imaged using a JEOL 1400 TEM.
Results
Displacement strands
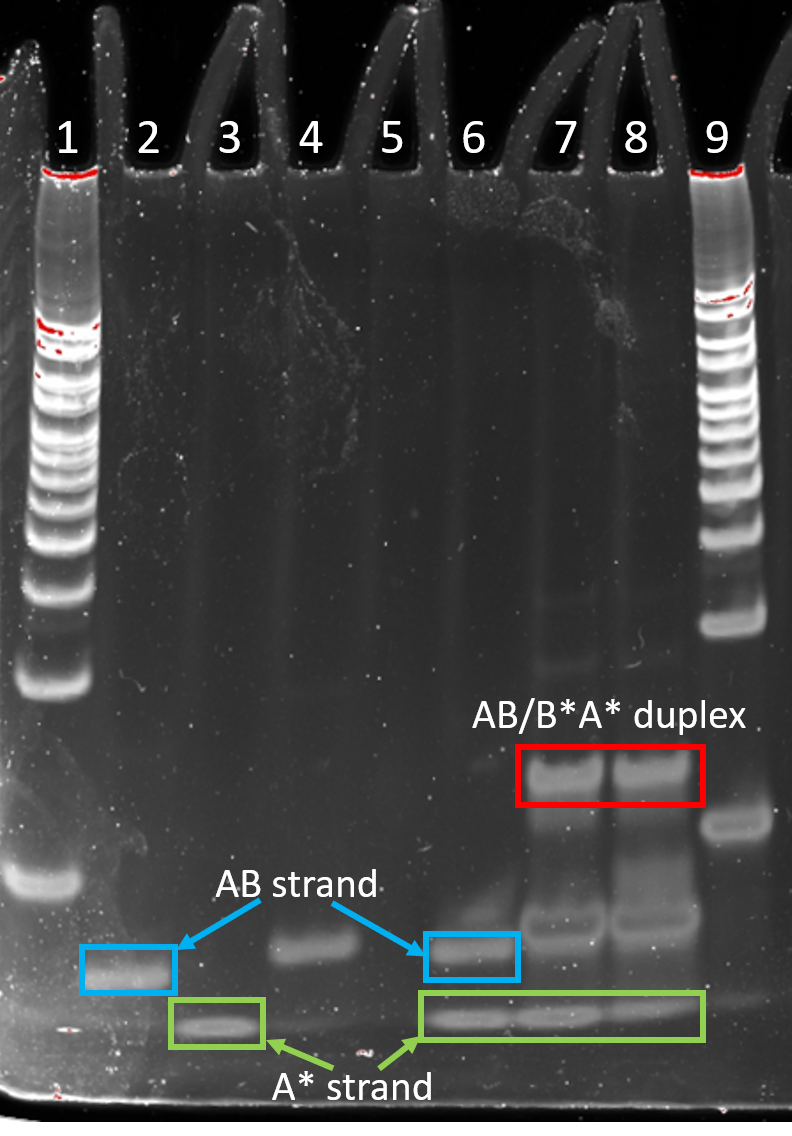
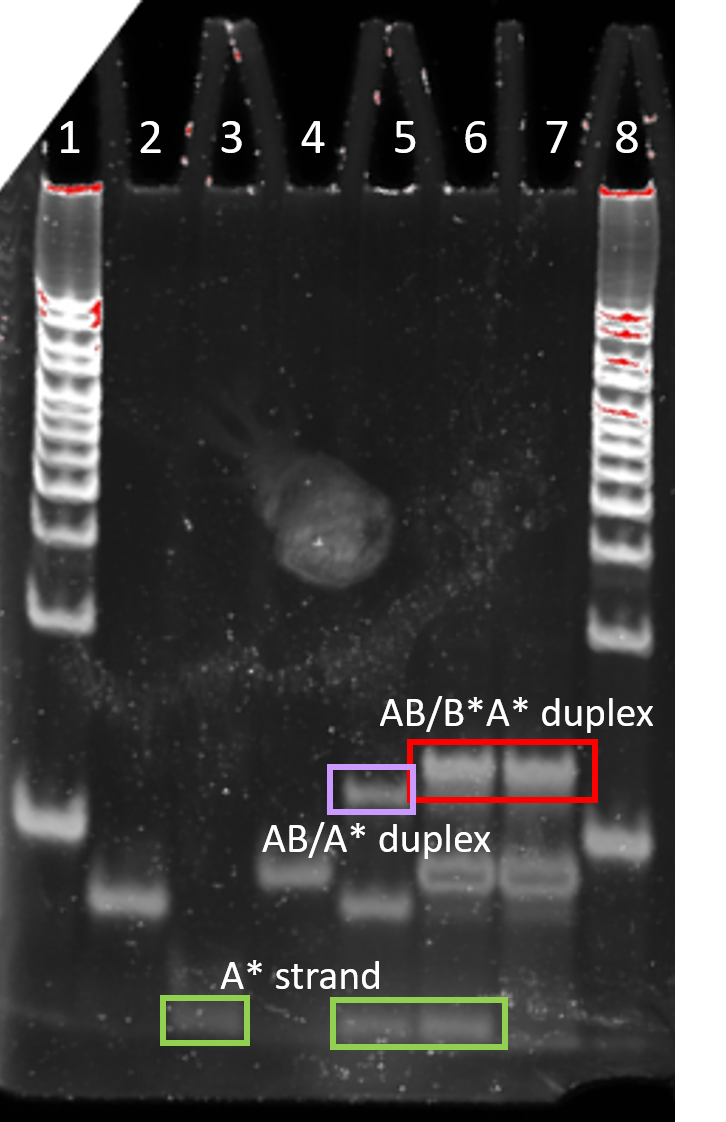
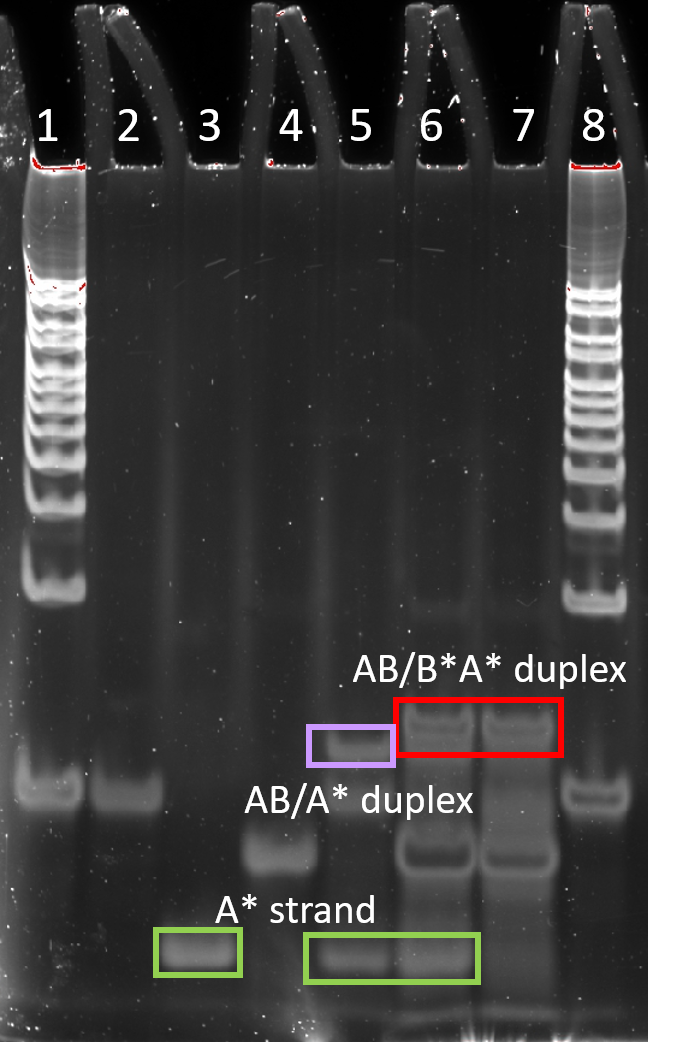
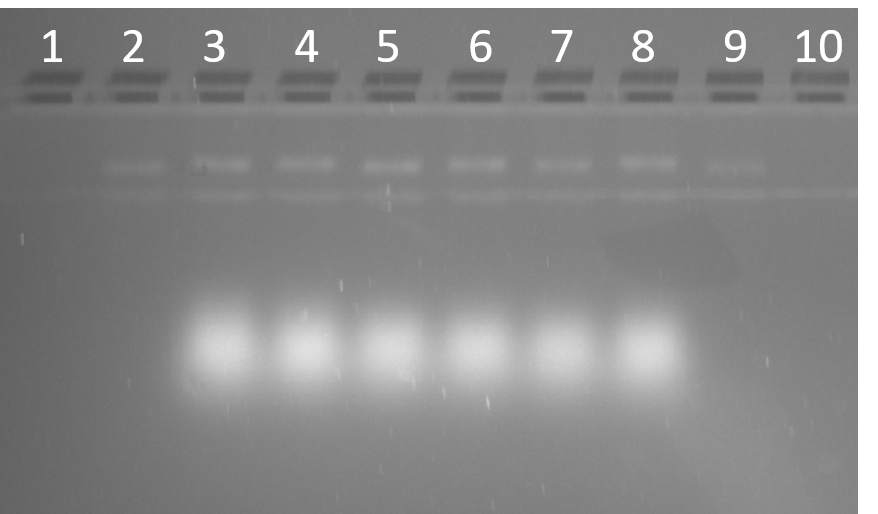
Three sets of displacement strands were designed (Figure 4.2 - 4.3). In set 1, the AB/B*A* duplex formed correctly, however, the AB/A* duplex did not, with both free AB and A* strands observed in PAGE (Figure 4.2, Lane 6). In Set 2 and 3, annealing AB and A* formed the AB/A* duplex and with the addition of B*A* lead to the disappearance of the AB/A* duplex and the appearance of free A* strand, indicating a successful strand displacement as the AB/B*A* duplex is formed (Figure 4.3 and 4.4). The AB/B*A* duplex band runs slower than the AB/A* duplex due to B*A* having a larger size than A* thus retarding more (Figure 4.3 and 4.4).
Figure 4.2. Strand displacement set 1. 10% PAGE run for 30 min at 180 V. Lane 1: 25 bp ladder, Lane 2: strand AB, Lane 3: strand A*, Lane 4: strand B*A*, Lane 5: empty, Lane 6: AB and A* annealed for 10 min (95 to 25 °C), Lane 7: B*A* added to annealed AB/A* and incubated for 20 min at room temp, Lane 8: AB and B*A* annealed for 10 min (95 to 25 °C), Lane 9: 25 bp ladder.
Figure 4.3. Strand displacement set 2. 10% PAGE run for 30 min at 180 V. Lane 1: 25 bp ladder, Lane 2: strand AB, Lane 3: strand A*, Lane 4: strand B*A*, Lane 5: AB and A* annealed for 10 min (95 to 25 °C), Lane 6: B*A* added to annealed AB/A* and incubated for 20 min at room temp, Lane 7: AB and B*A* annealed for 10 min (95 to 25 °C), Lane 8: 25 bp ladder.
Figure 4.4. Strand displacement set 3. 10% PAGE run for 30 min at 180 V. Lane 1: 25 bp ladder, Lane 2: strand AB, Lane 3: strand A*, Lane 4: strand B*A*, Lane 5: AB and A* annealed for 10 min (95 to 25 °C), Lane 6: B*A* added to annealed AB/A* and incubated for 20 min at room temp, Lane 7: AB and B*A* annealed for 10 min (95 to 25 °C), Lane 8: 25 bp ladder.
Folding of DN2, DNAlien (no 6HB), DNAlien (with 6HB)
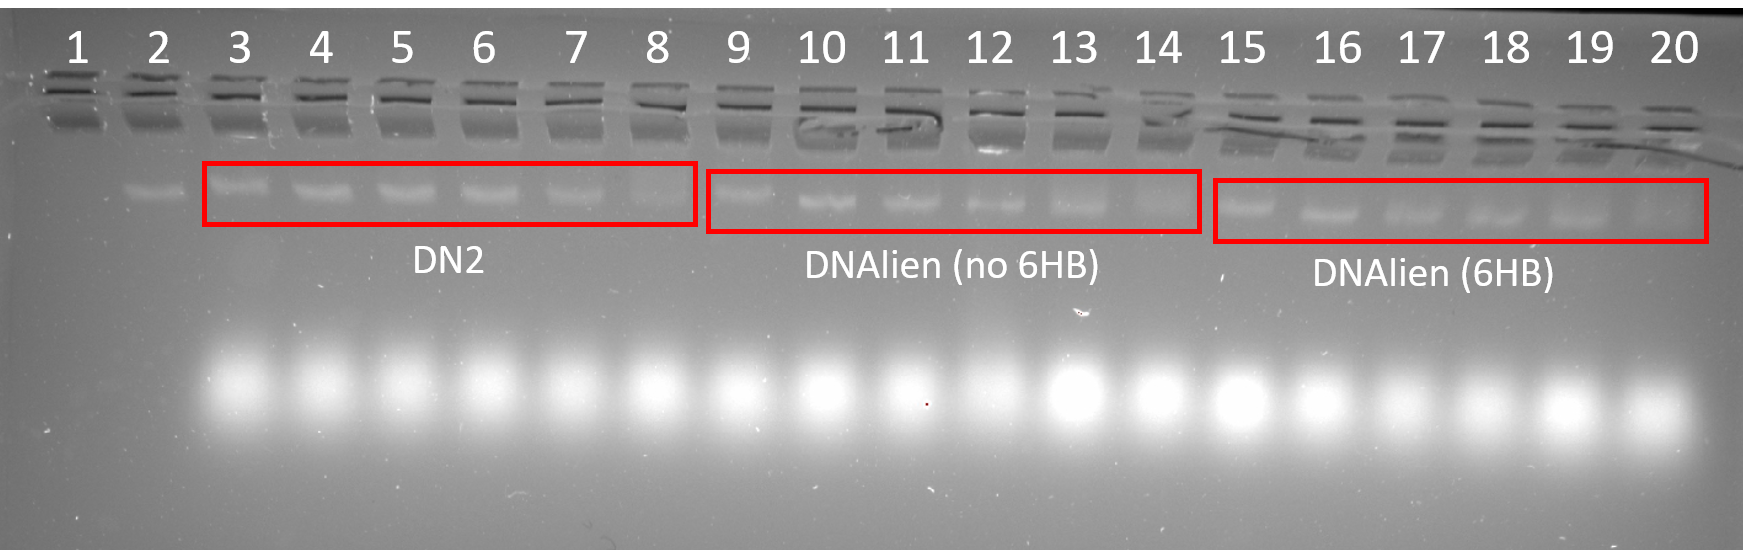
DN2, DNAlien (no 6HB) and DNAlien (with 6HB) were successfully folded at a range of MgCl2 concentrations. The most ideal folding condition can be identified by bands that run tightly and are of high intensity as this suggests homogenous folding and high yield. For all structures band intensity was low for 24 mM MgCl2 indicating poor folding at this concentration. This is likely due to the increased aggregation of structures as a result of increased ionic strength of buffer. For DN2 the ideal MgCl2 concentration is 12 and 16 mM, and for DNAlien (no 6HB) and DNAlien (with 6HB) 8 mM.
Figure 4.5. Folding of DN2, DNAlien (no 6HB) and DNAlien (with 6HB). 2% agarose (11 mM MgCl22) run for 2.5 h at 60 V. Lane 1: 1 kb ladder, Lane 2: p7308 scaffold (10 nM), Lane 3-8: DN2 folded in 4 mM, 8 mM, 12 mM, 16 mM, 20 mM and 24 mM MgCl2 respectively, Lane 9-14: DNAlien (no 6HB) folded in 4 mM, 8 mM, 12 mM, 16 mM, 20 mM and 24 mM MgCl2 respectively, Lane 15-20: DNAlien (with 6HB) folded in 4 mM, 8 mM, 12 mM, 16 mM, 20 mM and 24 mM MgCl2 respectively.
Folding DNAlien (with 6HB) in different states
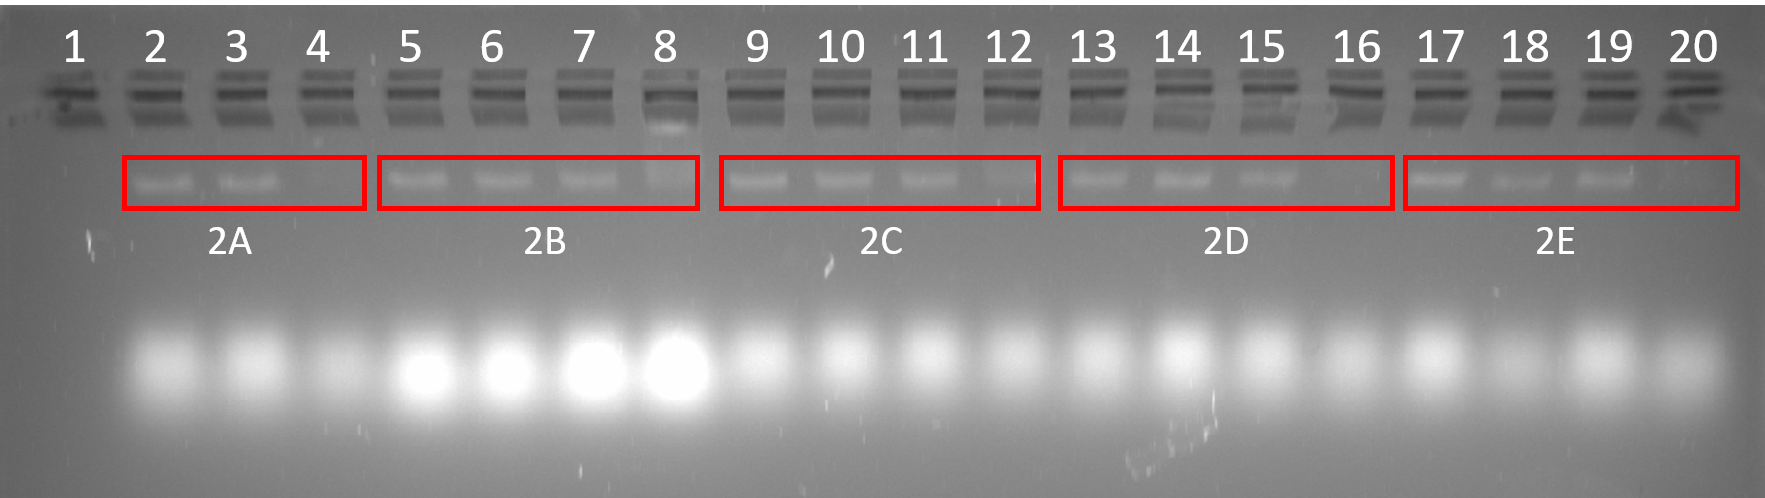
For all states of the DNAlien (with 6HB) 20 mM MgCl2 is too high for folding and leads to loss of yield due to aggregation as seen by the low intensity bands (Figure 4.5). The best MgCl2 concentrations for the different folded states of DNAlien (6HB) are 12 mM and 16 mM for the unlocked (2A, 2C) and locked closed (2B) states (Figure 4.6). For the locked open and fixed opened states lower MgCl2 are optimal, with locked open (2D) folding best at 8 and 12 mM and fixed open (2E) folding best at 8 mM (Figure 4.6).
Figure 4.6. Folding DNAlien (with 6HB) in different states. 2% agarose (11 mM MgCl2) run for 2.5 h at 60 V. Lane 1: 1 kb ladder, Lane 2-4: 2A folded at 12 mM, 16 mM and 20 mM MgCl2 respectively, Lane 5-8: 2B folded at 8 mM, 12 mM, 16 mM and 20 mM MgCl2 respectively, Lane 9-12: 2C folded at 8 mM, 12 mM, 16 mM and 20 mM MgCl2 respectively, Lane 13-16: 2D folded at 8 mM, 12 mM, 16 mM and 20 mM MgCl2 respectively, Lane 17-20: 2E folded at 8 mM, 12 mM, 16 mM and 20 mM MgCl2 respectively.
Cholesterol tagging
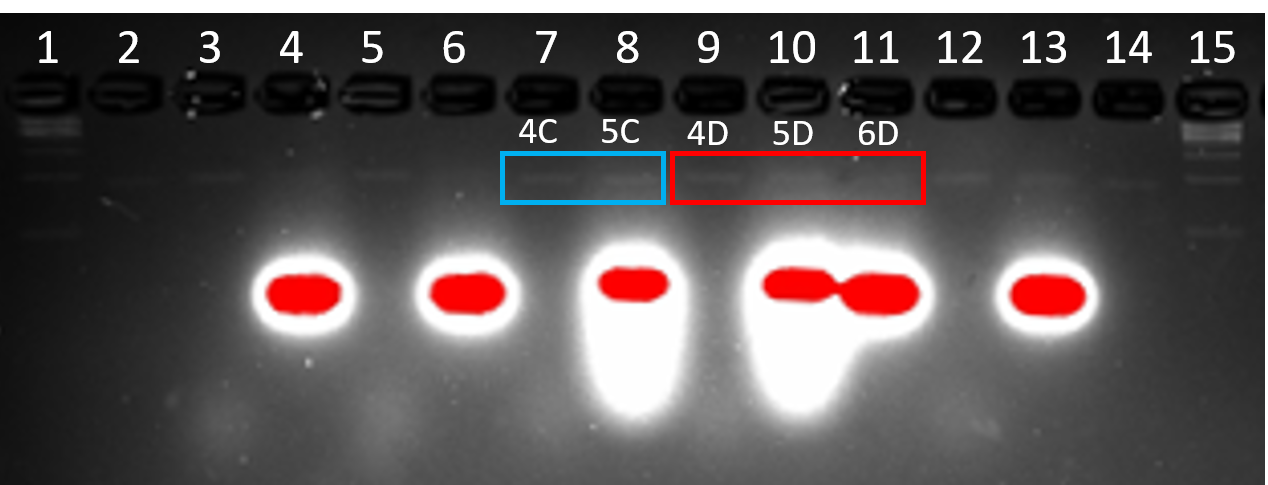
DN2, DNAlien (no 6HB) and DNAlien (with 6HB) were folded with and without handle modifications at H12 and H26 and excised from agarose purification gel (Figure 4.7). Cholesterol anti-handles where then added, which should only attach or tag the structure if the structure has been decorated with the handle. In Figure 4.8, structure 4C is the DNAlien (no 6HB) without handles whilst 4D is the variant decorated with handles. Both were treated with cholesterol anti-handles in the absence of octyl glucoside to afford 5C and 5D respectively. The bands for 4C and 5C run at the same speed suggesting they are identical (Figure 4.8). In Figure 4.8, band 5D runs slower than 4D suggesting that cholesterol anti-handles have hybridised to the structure and as a result runs slower because of the larger structure. Structure 6D is the same as 5D and should be hybridised with the cholesterol anti-handle but in the presence of octyl glucoside detergent. The hybridisation of cholesterol anti-handle to structures in the absences and presence of detergent cannot be compared by band intensity because samples were normalised to 0.6 nM and 0.5 nM respectively. In the future this result will be repeated with longer gel running time and normalised concentration, to determine the yield of cholesterol strand hybridisation, and determine the dependence of this on detergent concentration.
Figure 4.7. Folding DNAlien (with 6HB) in different states. 2% agarose (11 mM MgCl2) run for 2.5 h at 60 V. Lane 1: 1 kb ladder, Lane 2-4: 2A folded at 12 mM, 16 mM and 20 mM MgCl2 respectively, Lane 5-8: 2B folded at 8 mM, 12 mM, 16 mM and 20 mM MgCl2 respectively, Lane 9-12: 2C folded at 8 mM, 12 mM, 16 mM and 20 mM MgCl2 respectively, Lane 13-16: 2D folded at 8 mM, 12 mM, 16 mM and 20 mM MgCl2 respectively, Lane 17-20: 2E folded at 8 mM, 12 mM, 16 mM and 20 mM MgCl2 respectively.
Figure 4.8. Treatment of DN2 and DNAlien with cholesterol anti-handles. 2% agarose (11 mM MgCl2 ) run for 2.5 h at 60 V. Lane 1: 1 kb ladder, Lane 2: p7308 scaffold, Lane 3: 4A, Lane 4: 6A, Lane 5: 4B, Lane 6: 6B, Lane 7: 4C, Lane 8: 5C, Lane 9: 4D, Lane 10: 5D, Lane 11: 6D, Lane 12: 4F, Lane 13: 6F, Lane 14: p7308 scaffold, Lane 15: 1 kb ladder.
TEM
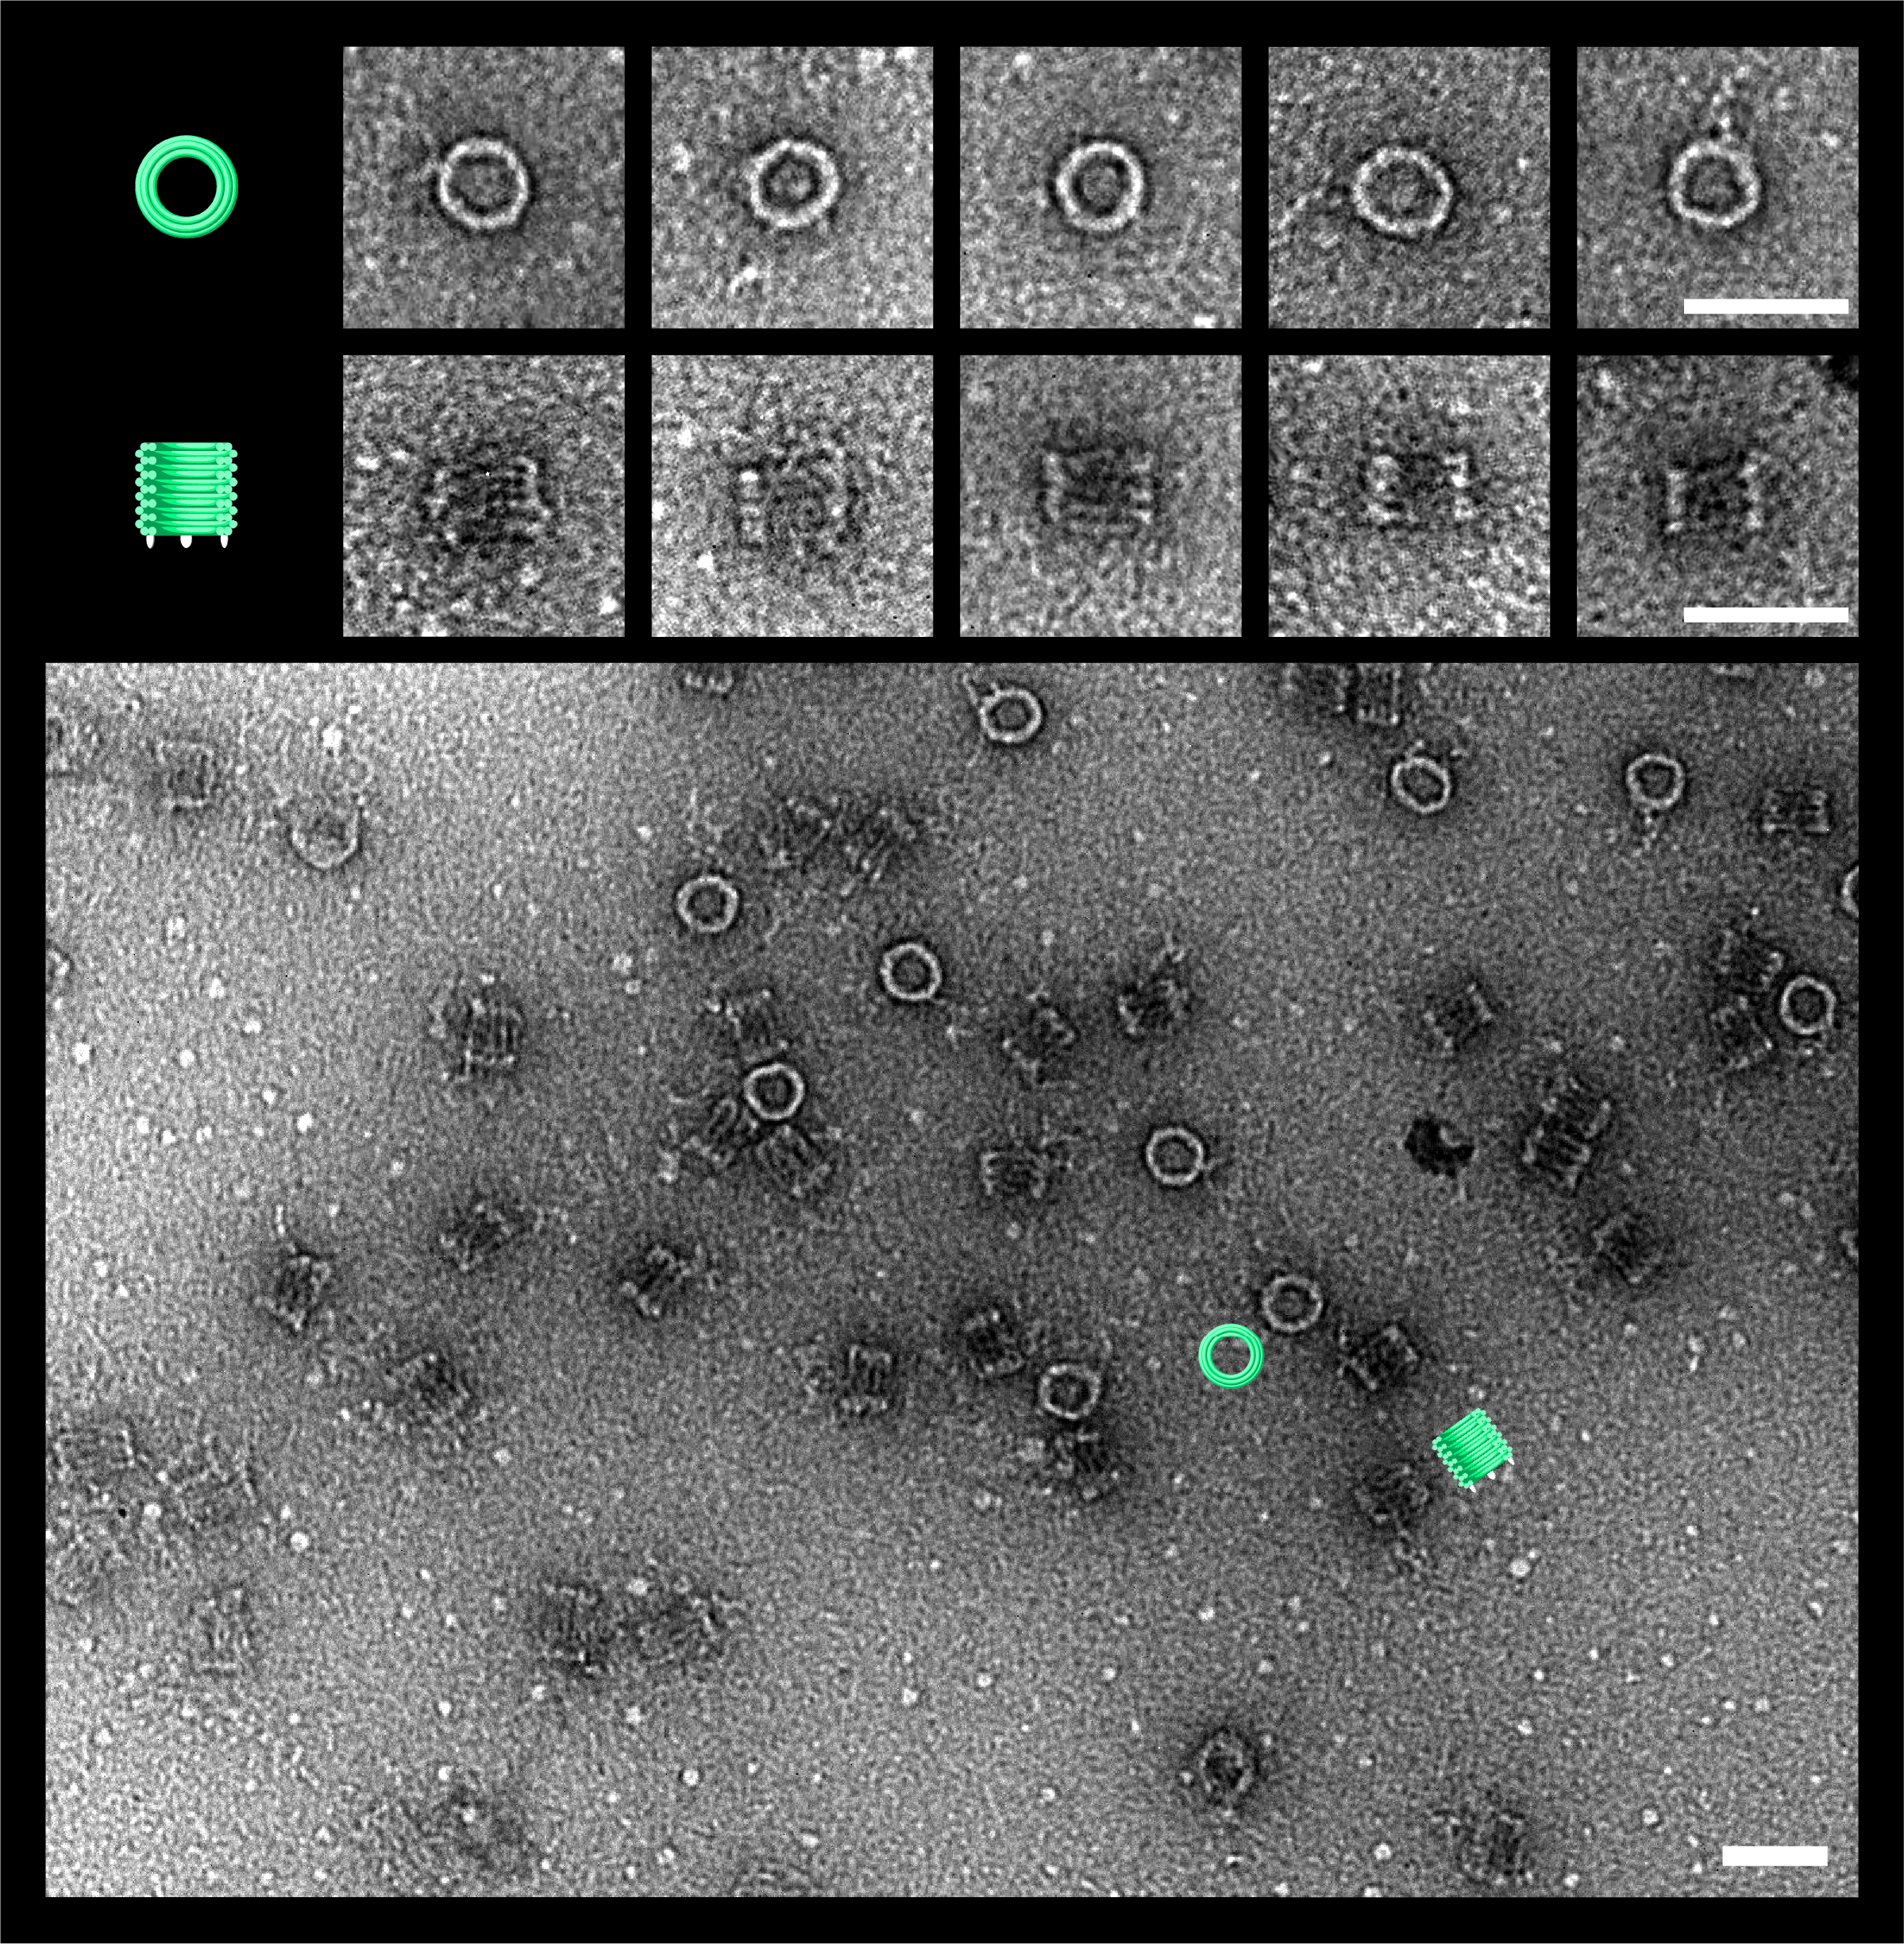
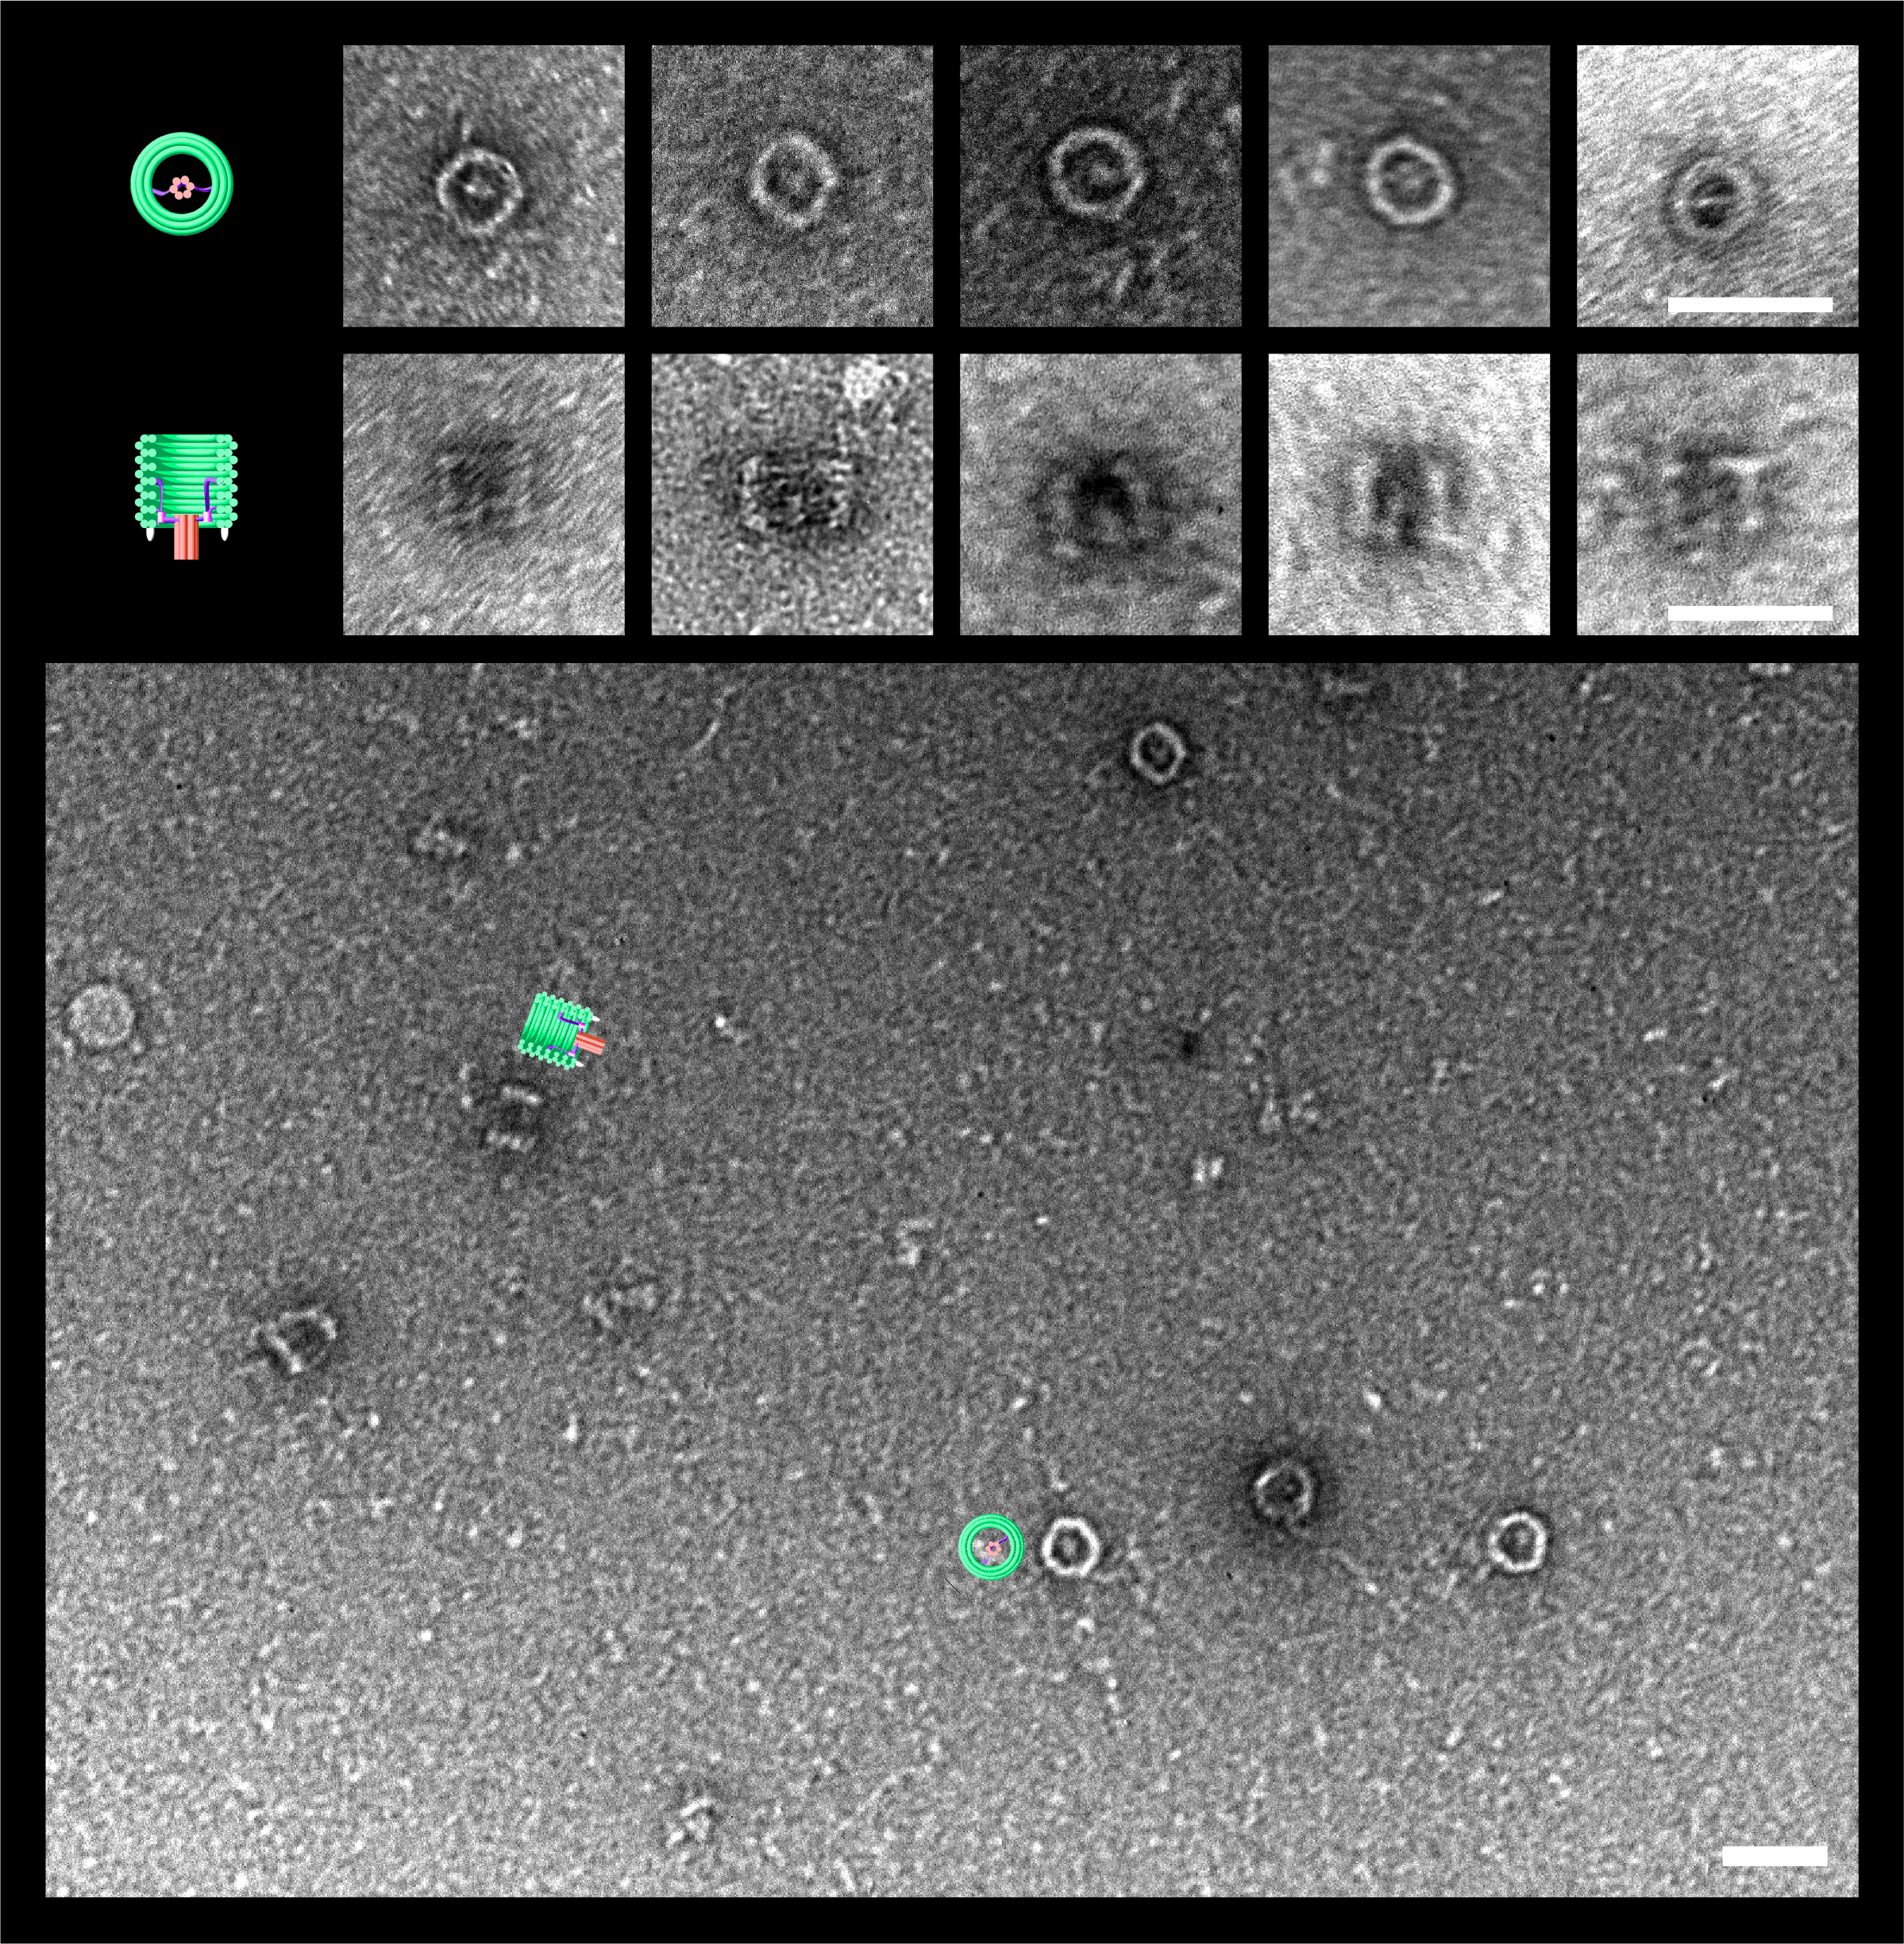
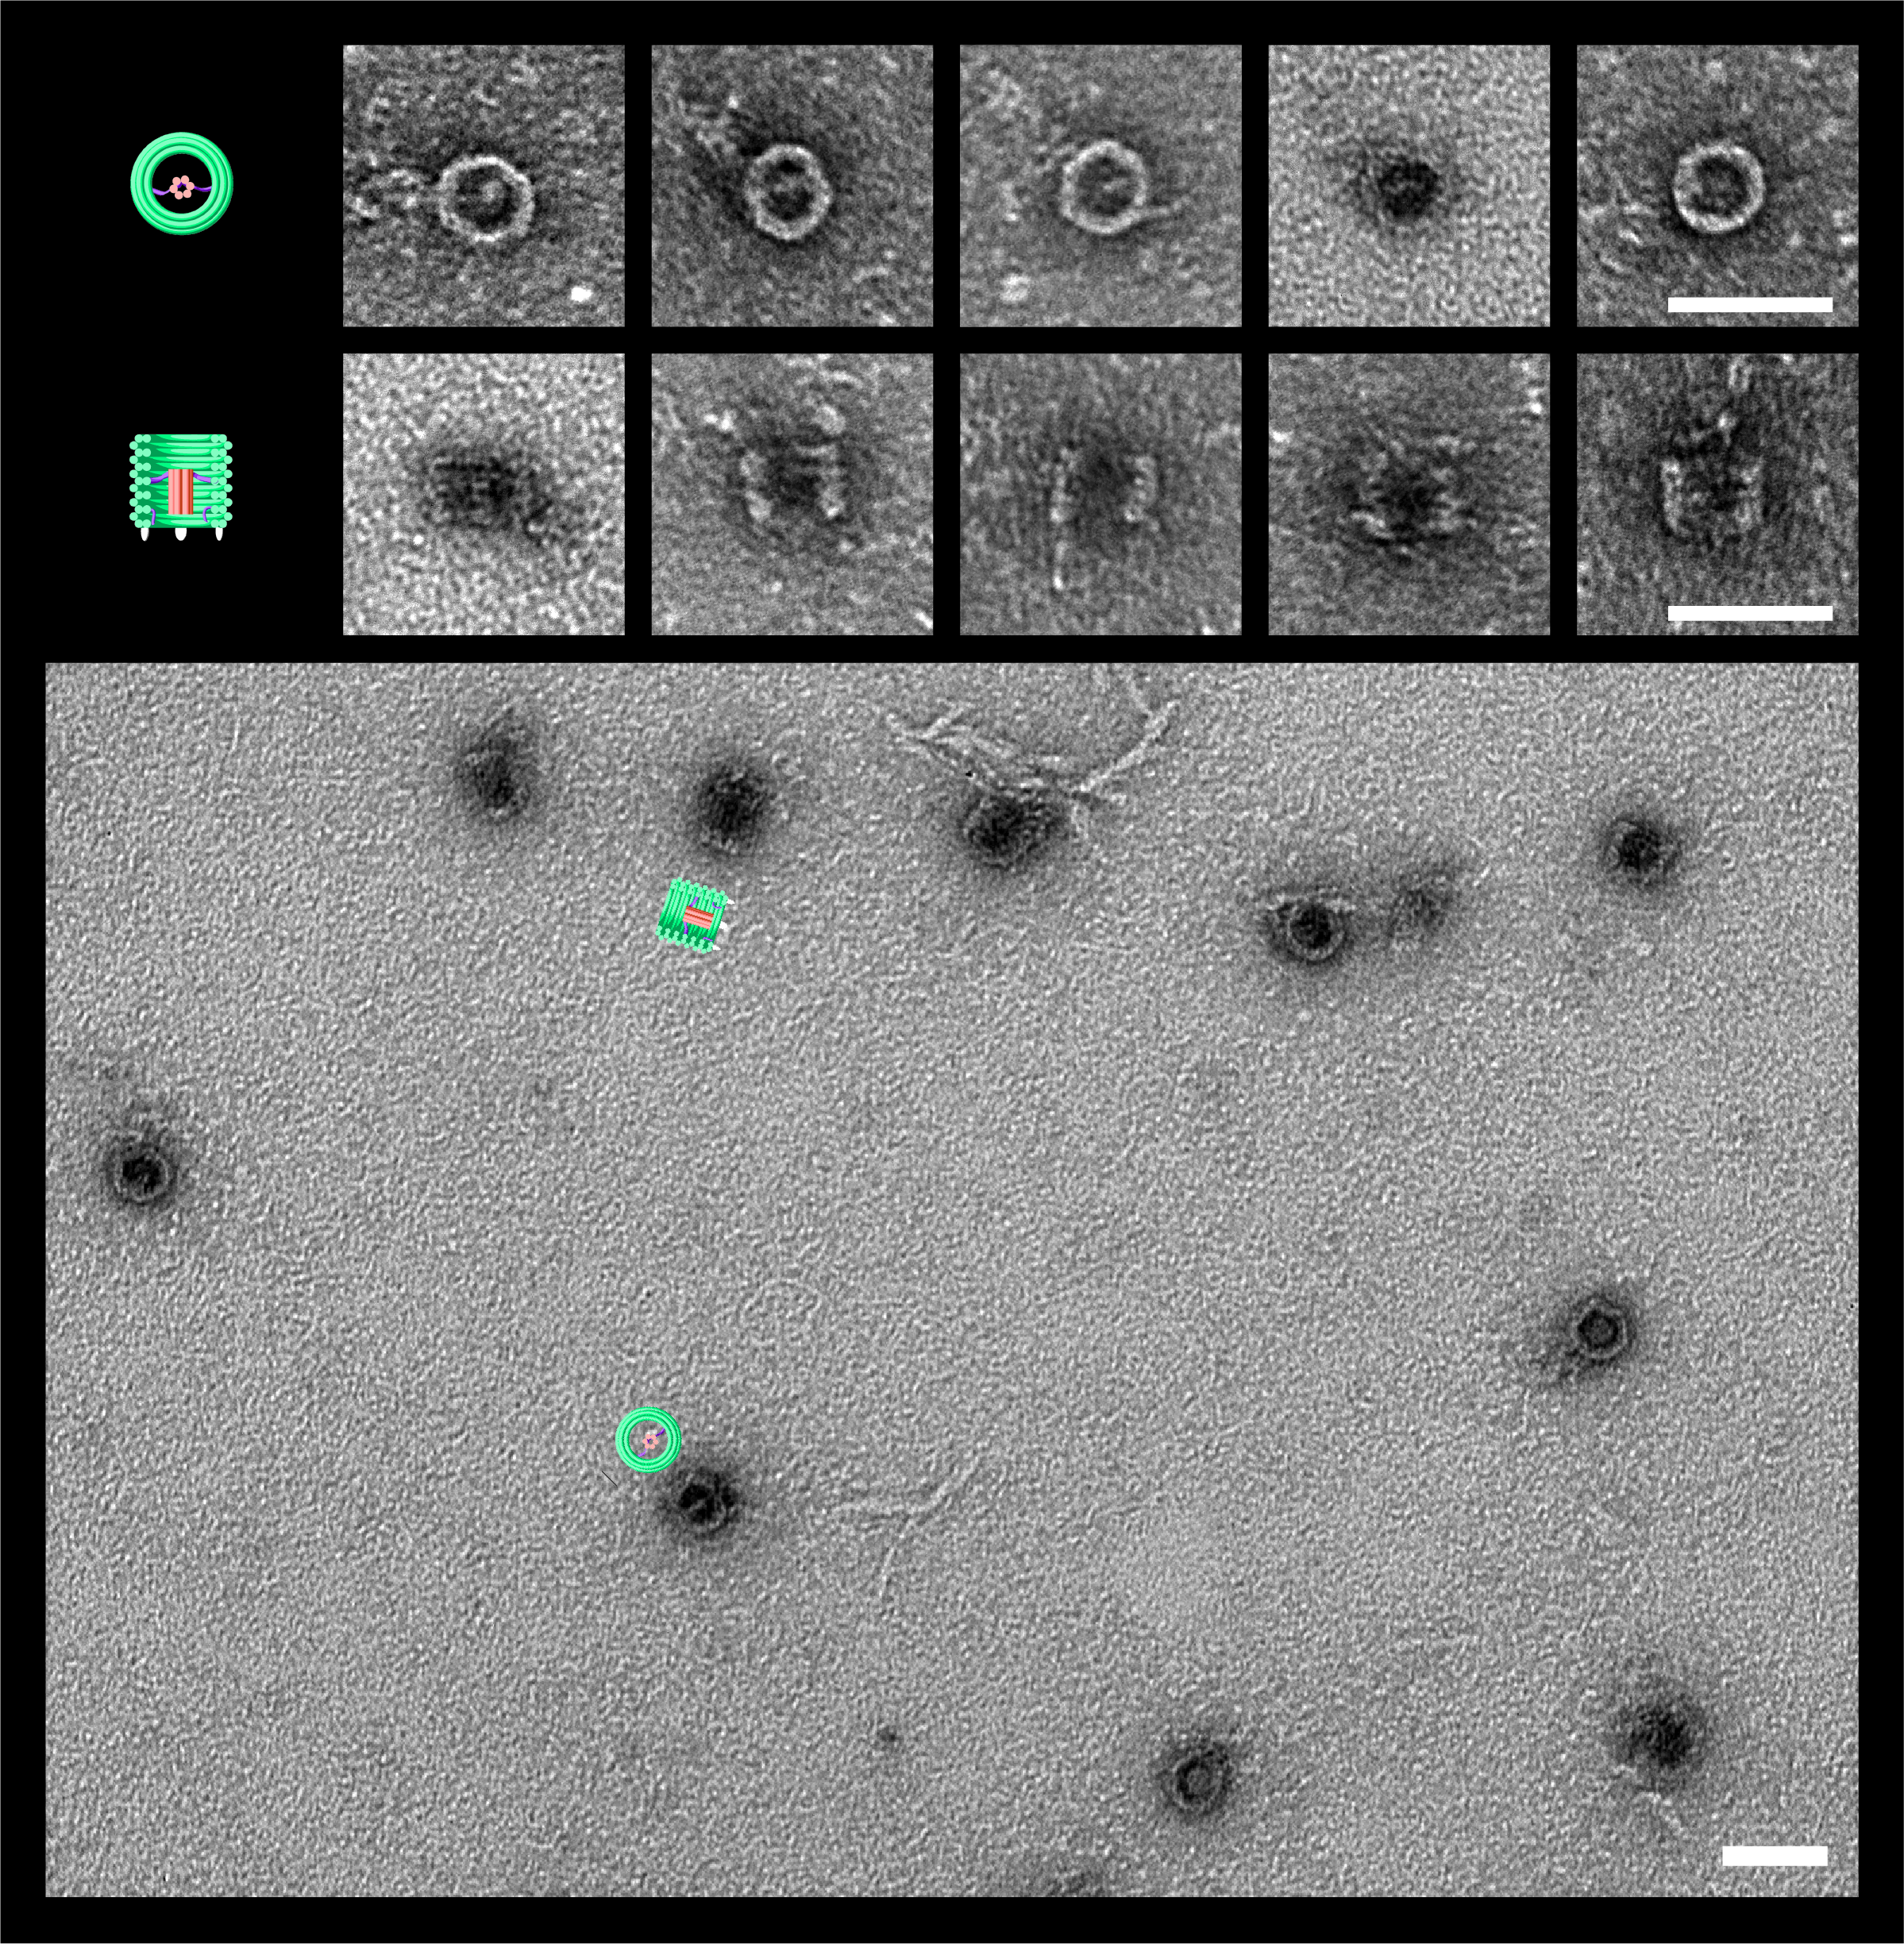
We obtained TEM images for three DNAlien samples, no pore (Figure 4.9), pore in the ‘locked open’ state (Figure 4.10), and pore in the ‘unlocked’ state (Figure 4.11)
Figure 4.9.TEM images of the DNAlien folded without a central pore. DNAlien model and TEM images are shown as viewed from: top view (first row), side view (second row) and a zoomed out image of the grid (bottom). Scale bars 50 nm.
Figure 4.10.TEM images of the DNAlien folded with a central pore in the ‘locked open’ state. DNAlien model and TEM images are shown as viewed from: top view (first row), side view (second row) and a zoomed out image of the grid (bottom). Scale bars 50 nm.
Figure 4.11.TEM images of the DNAlien folded with a central pore in the ‘unlocked’ state. DNAlien model and TEM images are shown as viewed from: top view (first row), side view (second row) and a zoomed out image of the grid (bottom). Scale bars 50 nm.
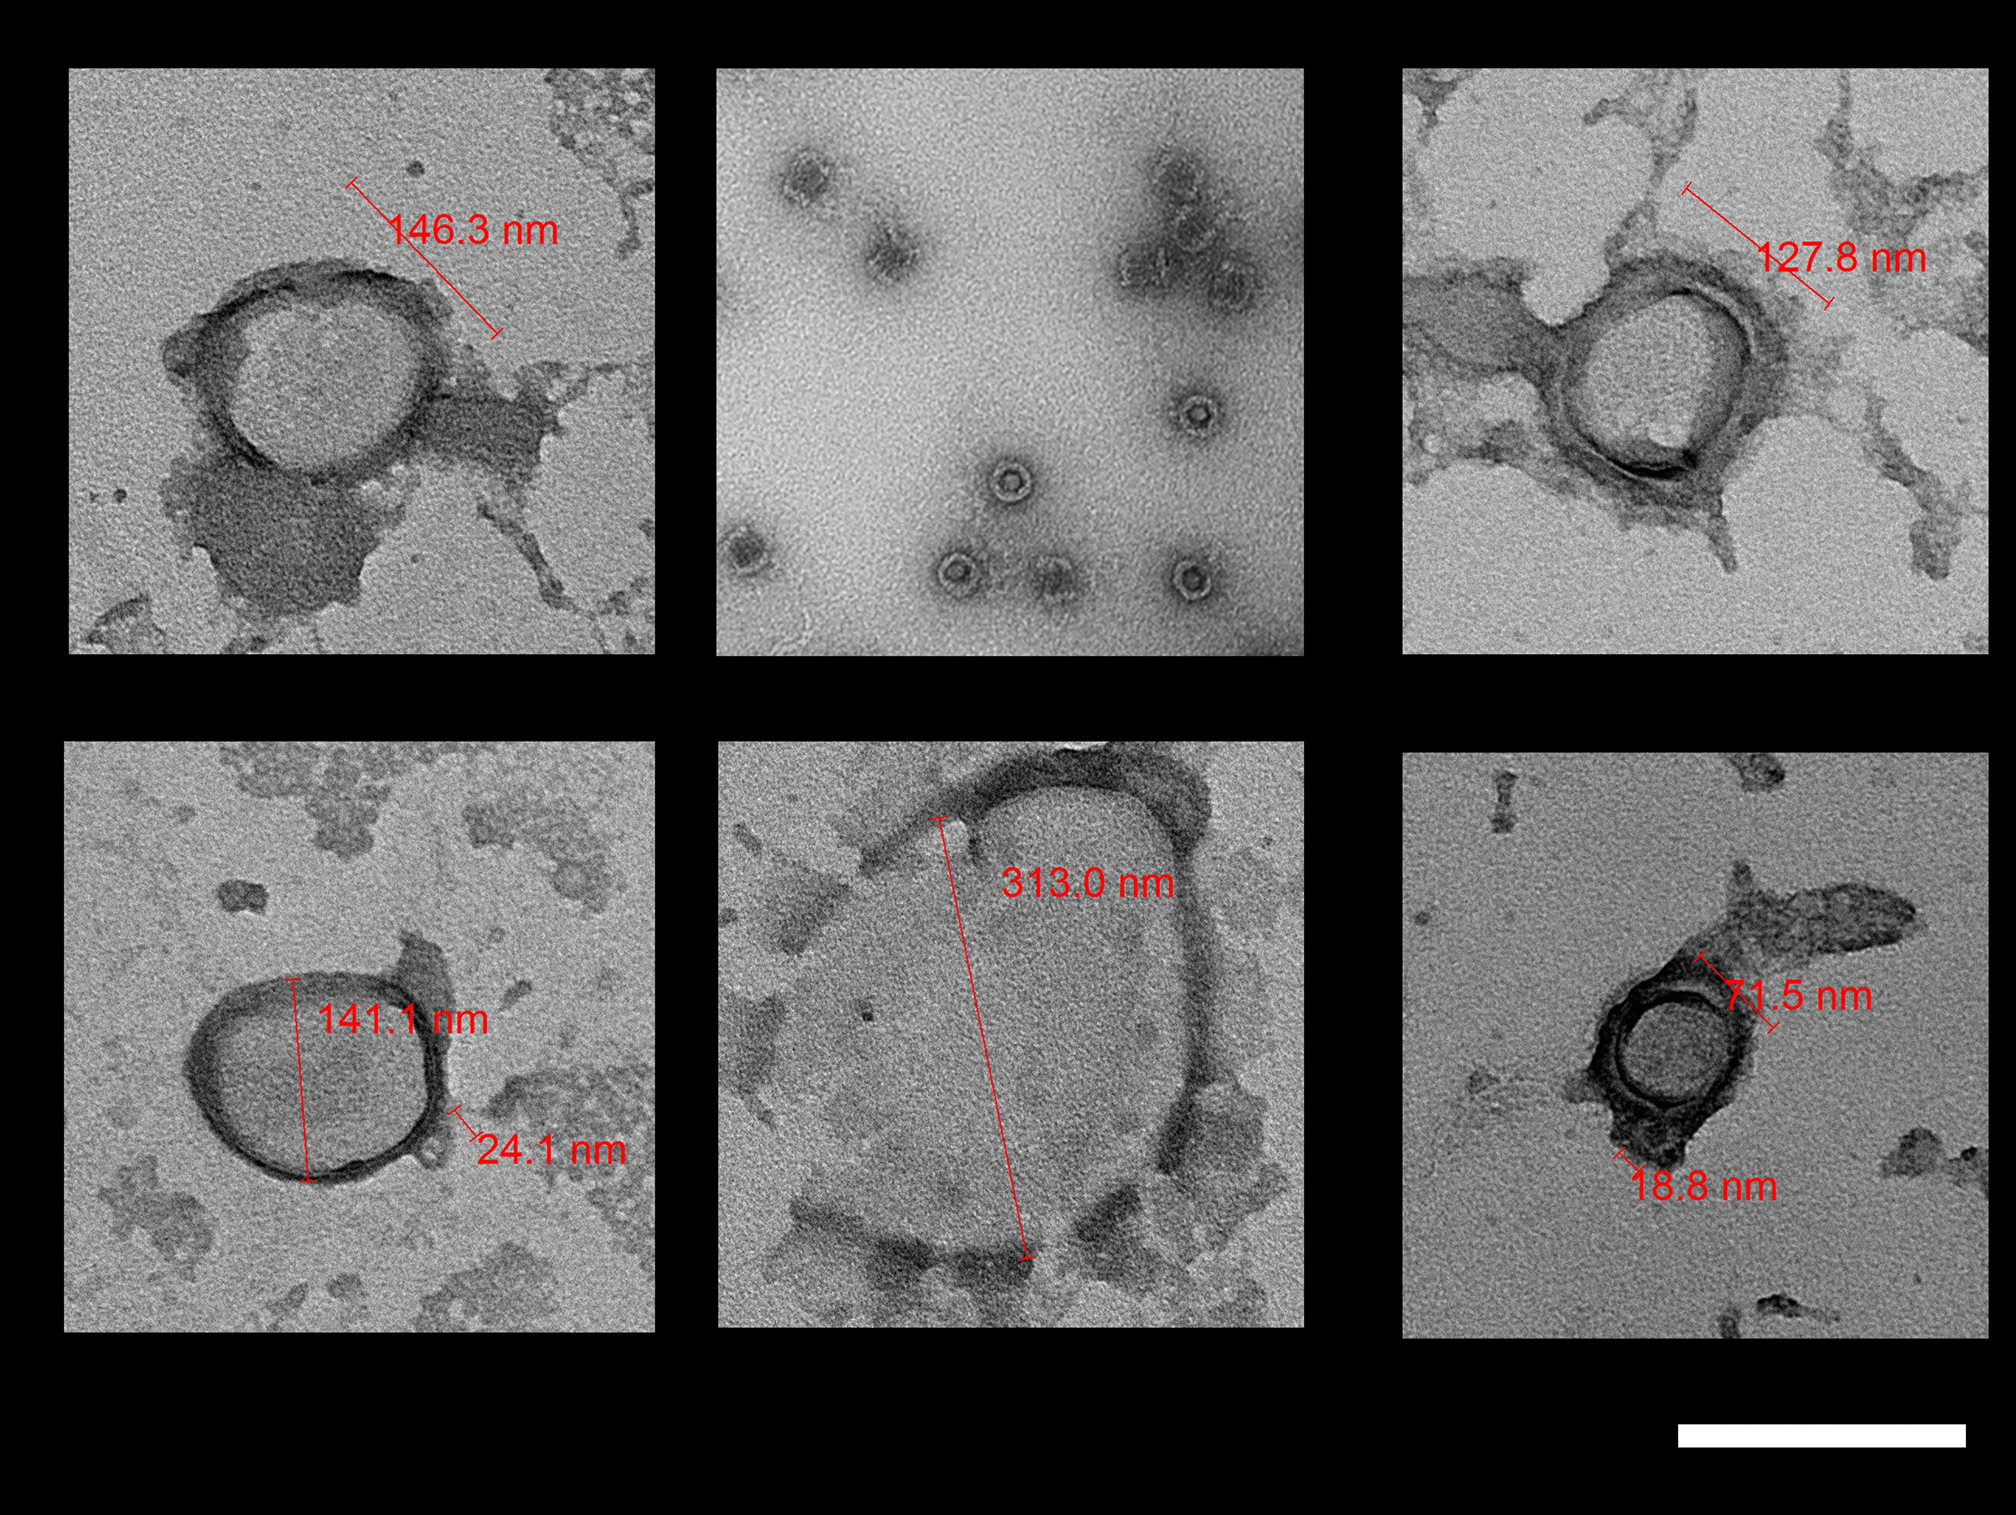
Figure 4.12.TEM images of cholesterol modified DNAlien incubated with liposomes. While liposomes are clearly imaged, DNAlien docking was not detected. An example image of a DNAlien sample without liposomes is shown for comparison, and is to scale (centre, top row). Scale bar 200 nm.
Discussion
In these experiments optimisation of MgCl2 concentration was determined by qualitatively assessing band intensity. For the new structure DNAlien the optimal MgCl2 concentration for folding is 8 mM (Figure 4.5). However, depending on state of the DNAlien (with 6HB) optimal MgCl2 varies from 8 and 16 mM (Figure 4.6). In the future, MgCl2 will be further optimised by repeating experiments and quantifying band intensities to better determine optimal concentration. Moreover, TEM of the same structure folded in different MgCl2 concentrations could afford information about optimal concentration.
A challenge in these experiments was low yields of DNA origami after band excision and purification. These low yields meant low yields were propagated through subsequent carry-on experiments. In the cholesterol tagging experiments, DNA origami concentrations were normalised to 0.5-0.6 nM. This low concentration made further agarose gel electrophoresis hard to assess as bands were low in intensity and hard to image (Figure 4.8). The hybridisation of cholesterol anti-handles was performed both in the absence and presence of detergent. Optimal condition for cholesterol tagging was not determined because band intensities were not comparable as samples were not normalised to the same concentration between conditions. In the future, this experiment will be repeated at higher concentrations by first concentrating DNA origami samples before treatment with cholesterol anti-handles and samples will be normalised to the same concentration for comparison between treatment in absence and presence of detergent. There is interest in folding structures in absence of detergent because to study DNA origami interactions with liposomes detergent needs to be removed to avoid lysis of liposomes.
In all our TEM images, the outer barrel of the DNAlien folds well, and is consistent with results in the literature [1]. The diameter of the barrel corresponds well to the literature value of 30 nm. Thus, the scaffold path modification we made in our design to introduce the tether did not disrupt the folding of the DNA origami barrel.
There is a clear difference between the DNAlien folded with and without a pore. For the no-pore sample, in the top view the centre of the barrel is empty as expected (Figure 4.9). For the ‘locked open’ pore, from the top view the central pore is clearly visible in the centre of the barrel (Figure 4.10). For some particles in this sample, from the side view there is also evidence of the a vertical pore inside the barrel. For the ’unlocked’ DNAlien, the pore is also visible from in the top view (Figure 4.11). However, in this case the position of the pore inside the barrel is more variable - and pores were also observed positioned towards the side wall. For the ‘unlocked’ DNAlien, it was very unlikely to see the pore in the side view, and this was only observed in one case (Figure 4.11, second row, leftmost image).
Thus, these images indicate differences between the DNAlien and the empty barrel, and suggest some difference between the different DNAlien states. This confirms the successful formation of our DNAlien consisting of an outer DNA barrel and an internal 6HB pore. Initial tests were made to check liposome docking of cholesterol-decorated DNAliens by TEM (Figure 4.12), but results were inconclusive and require repeating. Liposomes were clearly imaged under these conditions, but not the DNAlien barrel.
We observed some differences between the ‘open-locked’ and ‘unlocked’ states. In the open-locked state, we observe the pore more frequently in the centre of the barrel. In the unlocked state, we observe the pore less frequently overall, and it does not appear to be as well centred. In the unlocked state the pore has long tethers and is predicted to have a greater range of movement, and so we would expect the position observed by TEM to be more variable. This is consistent with our results so far. Thus, the results suggest that the DNAlien exists in at least two different states, open and unlocked. Future work to confirm this will involve an analysis of pore position over a larger sample size, to show that this observation is statistically significant.
FRET (Fluorescence Resonance Energy Transfer) measurements have been used to show the switching of DNA nanostructures between states, and can also be used to measure switching kinetics [2]. The super-resolution optical microscopy technique DNA PAINT, has also been used to characterise DNA nanostructures to nanometre precision in solution [3]. In future work we will use DNA PAINT imaging to more more clearly identify the position of the pore relative to the barrel, and FRET measurements to observe switching.
Conclusion
Experimental results successfully validated the design of displacement strands set 2 and 3, however set 1 was not effective at forming the AB/A* duplex possible through insufficient affinity of A* for AB.
The presence of the 6HB did not perturb the folding of the barrel structure, whereby DNAlien no 6HB folded the best at 12 mM MgCl2 and DNAlien_6HB folded best at 8 mM. The different states of DNAlien were successfully folded at 12 mM and 16 mM.
As predicted, cholesterol tagging with an anti-handle was only successful when the scaffold was decorated with handles; observable by a slight retardation of movement down the gel.
By TEM we confirmed that our DNAlien folds correctly, with a pore inside the barrel. The results also suggest that the DNAlien can exist in two states; locked where the cable is held tense and unlocked where the pore is free to move through and out of the barrel.
Overall, our experimental results were able to successfully validate the theoretical designs behind the DNAlien assembly.
References
[1] Ponnuswamy, N.; Bastings, M. M. C.; Nathwani, B.; Ryu, J. H.; Chou, L. Y. T.; Vinther, W.; Li, W. A.; Anastassacos, F. M.; Mooney, D. J.; Shih, W. M.; Oligolysine-Based Coating Protects DNA Nanostructures from Low-Salt Denaturation and Nuclease Degradation. Nat. Commun. 2017, 8, 1.
[2] Yurke, B.; Turberfield, A. J.; Jr, A. P. M.; Simmel, F. C.; Neumann, J. L. A DNA-fuelled molecular machine made of DNA. Nature 2000, 406, 605–608.
[3] Schnitzbauer, J., Strauss, M.T., Schlichthaerle, T., Schueder, F., and Jungmann, R. Super-resolution microscopy with DNA-PAINT. Nat. Protoc. 2017, 12, 1198–1228.